
'The steepest slopes on Baldwin St' is a reimagining of classic sequence 'Gradient and Tangent'
- On the 'In this sequence' tab you'll find all the lessons in this sequence, a suggested implementation plan and curriculum alignment.
- The 'Behind this sequence' tab shows how key mathematical ideas develop over the sequence.
- Have you taught this sequence? Use the Feedback button to let us know how it went!
Lessons in this sequence
Lesson 1 • Measuring steepness
Students investigate how steep Baldwin Street is, analyse images to obtain a steepness value, compare approaches, and discover through real road signs that engineers use gradient, not angles, to communicate steepness.

Lesson 2 • Gradient, angle, and tangent
Students formalise gradient as a percentage, connect gradient to the tangent ratio, and investigate why percentages, not angles or decimals, are the standard for communicating steepness.

Lesson 3 • Communicating steepness to road users
Students use their understanding of gradient to interpret real measurements of Baldwin Street, make decisions about how to represent steepness for different audiences, and design road signs that balance mathematical accuracy with clarity.

The Australian Academy of Science supports and encourages broad use of its material. Unless indicated below, copyright material available on this website is licensed under a Creative Commons Attribution-NonCommercial-ShareAlike 4.0 International (CC BY-NC-SA 4.0) licence.
Curriculum and syllabus alignment
Year 9
Students find the distance between 2 points on the Cartesian plane, and the gradient and midpoint of a line segment.
Students solve problems involving ratio, similarity and scale in two-dimensional situations. Students apply Pythagoras’ theorem and use trigonometric ratios to solve problems involving right-angled triangles. They use mathematical modelling to solve practical problems involving direct proportion, ratio and scale, evaluating the model and communicating their methods and findings.
Algebra
Find the gradient of a line segment, the midpoint of the line interval and the distance between 2 distinct points on the Cartesian plane
Measurement
Solve spatial problems, applying angle properties, scale, similarity, Pythagoras’ theorem and trigonometry in right-angled triangles
Use mathematical modelling to solve practical problems involving direct proportion, rates, ratio and scale, including financial contexts; formulate the problems and interpret solutions in terms of the situation; evaluate the model and report methods and findings
Space
Recognise the constancy of the sine, cosine and tangent ratios for a given angle in right-angled triangles using properties of similarity
This sequence explores how steepness can be measured and represented using Baldwin Street (the world’s steepest residential street) as a real-world context. Students model the slope using right-angled triangles and describe steepness in multiple ways, including ratios, percentages, and angles. They also consider how steepness is communicated in practice, analysing road signage and designing their own signs for different users. In doing so, students make decisions about clarity, precision, audience, and purpose, recognising that mathematical representations shape how information is interpreted.
The core mathematical goal is to link gradient, defined as $\frac{\text{rise}}{\text{run}}$, to the tangent ratio in trigonometry. Students make explicit that $\tan(\theta) = \frac{\text{rise}}{\text{run}}$ and therefore that gradient and angle describe the same geometric relationship in different forms.
The sequence assumes some familiarity with rise and run, but the context also provides an opportunity to introduce or revisit rise/run as a meaningful comparison of vertical and horizontal change.
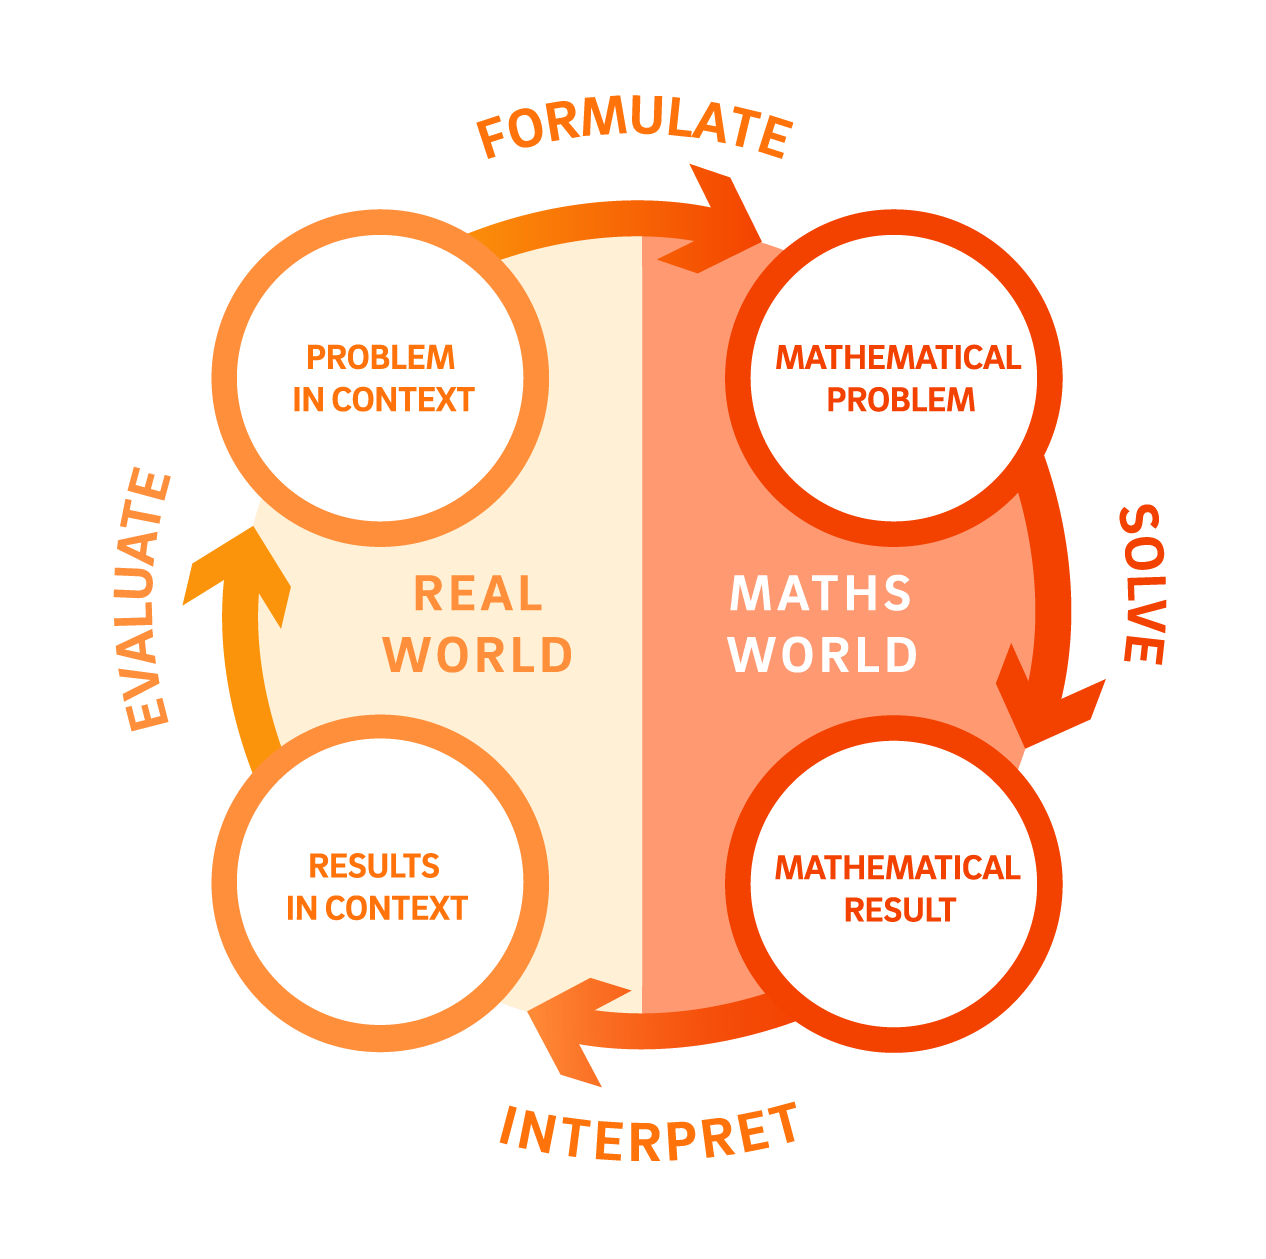
The process of mathematical modelling in this sequence
Formulate
Students watch a video of the Jaffa race on Baldwin Street and generate their own questions about the street. They investigate how to measure steepness using photographs, finding angle and $\frac{\text{rise}}{\text{run}}$ values with geometry tools.
Solve
Students formalise gradient as $\frac{\text{rise}}{\text{run}}$ and establish that $\tan(\theta) = \frac{\text{rise}}{\text{run}}$, making making explicit that gradient and angle are different expressions of the same geometric relationship. They verify this using their own measurements and investigate why percentage gradient is the standard for road signage, finding that equal changes in angle do not represent equal changes in steepness.
Interpret
Students apply their understanding to a side-on elevation profile of Baldwin Street, calculating gradients for individual sections and for the street as a whole. They consider what a single number on a road sign should represent, then design signs for different audiences, making decisions about which value to display, which representation to use, and how much rounding is acceptable.
Evaluate
Students compare their road sign designs, examining how choice of value, representation, and rounding affects how steepness is perceived. An optional extension uses Baldwin Street's disputed claim to the world's steepest residential street title to explore how the definition of "steepest" is itself a modelling decision.

'The steepest slopes on Baldwin St' is a reimagining of classic sequence 'Gradient and Tangent'
- On the 'In this sequence' tab you'll find all the lessons in this sequence, a suggested implementation plan and curriculum alignment.
- The 'Behind this sequence' tab shows how key mathematical ideas develop over the sequence.
- Have you taught this sequence? Use the Feedback button to let us know how it went!