'Statistics: Climb, slide or swing?' is one of our new teaching sequences for V9
- On the 'In this sequence' tab you'll find all the lessons in this sequence, a suggested implementation plan and curriculum alignment.
- The 'Behind this sequence' tab shows how key mathematical ideas develop over the sequence.
- Have you taught this sequence? Use the Feedback button to let us know how it went!
Lessons in this sequence
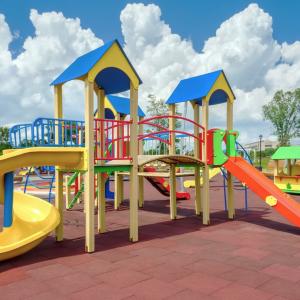
Lesson 1 • Designing a playground
Students design a playground that they imagine is fun for everyone.

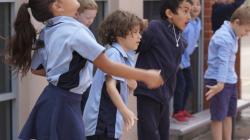
Lesson 2 • What’s your favourite activity?
Students conduct a survey to find what each member of the class likes to do in the playground.

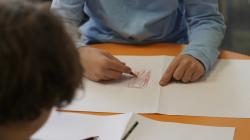
Lesson 3 • Playground data posters
Students represent the survey data as a poster.

Lesson 4 • Our playground story
Students collect data using a survey. They use the data to design a new playground where everyone can have fun.
Lesson 5 • A playground for our class
Students compare their imagined and data-informed playground designs to see the impact of the data on their decisions.
Suggested implementation
This time plan is just one way that you might choose to implement this sequence. We have based this plan on 50-minute lessons and the timings provided in the lessons’ documentation align with this implementation advice.
| Monday | Lesson 1 • Designing a playground Problem
|
|---|---|
| Tuesday | Lesson 2 • Favourite activities Plan & Data
|
| Wednesday | Lesson 3 • Playground data posters Data & Analyse
|
| Thursday | Lesson 4 • Our playground story Analyse & Conclusion
|
| Friday | Lesson 5 • A playground for our class Analyse & Conclusion
|
The Australian Academy of Science supports and encourages broad use of its material. Unless indicated below, copyright material available on this website is licensed under a Creative Commons Attribution-NonCommercial-ShareAlike 4.0 International (CC BY-NC-SA 4.0) licence.
Curriculum and syllabus alignment
Year 2
Students use a range of methods to collect, record, represent and interpret categorical data in response to questions.
Statistics
Acquire data for categorical variables through surveys, observation, experiment and using digital tools; sort data into relevant categories and display data using lists and tables
Create different graphical representations of data using software where appropriate; compare the different representations, identify and describe common and distinctive features in response to questions
We have used the PPDAC model to structure this sequence.
In Year 2, we develop students’ capacity to collect, record, represent and interpret categorical data in response to the question: What would we have in a playground where everyone in our class can have fun?.
Categorical data is data that can be classified or "categorised" into groups. In this sequence, students use a survey to collect categorical data on preferred playground activities. Students categorise data into groups through observation and survey, and use consistent methods to collect and record this categorical data. This sequence develops the idea that the data they collected has an impact on students’ final playground designs.
| Investigations | Learning goals | Students’ mathematical activity |
|---|---|---|
Lesson 1 • Designing a playground PROBLEM | We can anticipate answers to questions based on our ideas and experience. | Students design a playground that they imagine is fun for everyone. |
Lesson 2 • Favourite activities PLAN & DATA | Surveys are a way to collect data. | Students design a survey to collect and record responses. |
Lesson 3 • Playground data posters DATA & ANALYSE | The ways that we represent data helps us see the story that the data is telling. | Students represent the data so that it makes sense to them. |
Lesson 4 • Our playground story ANALYSE & CONCLUSION | Data is used to answer questions and make inferences to tell a story. | Students make sense of their place in the class data story. |
Lesson 5 • A playground for our class ANALYSE & CONCLUSION | Data provides evidence to inform our decisions. | Students compare the data in their first and second designs to notice how data informed their second design. |

'Statistics: Climb, slide or swing?' is one of our new teaching sequences for V9
- On the 'In this sequence' tab you'll find all the lessons in this sequence, a suggested implementation plan and curriculum alignment.
- The 'Behind this sequence' tab shows how key mathematical ideas develop over the sequence.
- Have you taught this sequence? Use the Feedback button to let us know how it went!