Prediction is the most powerful tool in statistics and one that ties all other concepts, processes and skills together. Statistics as a field (and as a strand of the mathematics curriculum) provides a set of highly effective concepts, tools, practices and dispositions to strengthen our capacity to make predictions. Although the formal tools of prediction (i.e. statistical inference) aren’t taught until senior secondary school or early tertiary, foundational ideas that support useful predictions can be built from the earliest years of schooling.
While descriptive statistics tell us about data we have currently, inference allows us to make an informed prediction based on that data. A prediction is more than a wild guess or claim based on an opinion. We anticipate and predict weather based on information, such as observations of current cloudy conditions. These predictions contain some uncertainty, as not all predictions end up coming true. We might express a prediction as “I think it is going to rain tomorrow because it was very cloudy today”. This example highlights three fundamental elements of a prediction:
- Making a claim beyond what is currently known: Predictions are making claims about the unknown. For example, the phrase “…it is going to rain tomorrow...” is a claim beyond current conditions. In contrast, a descriptive claim states an observation (“it is raining”) or recounts a past event (“it rained on Monday and Wednesday this week”).
- Using data as evidence for our prediction: Data and experience justify our predictions. For example, “...because it was very cloudy today” establishes reasoning based on evidence. In contrast, a claim without credible evidence could be based on opinion (“...because I like rain”).
- Articulating uncertainty: As opposed to an observation or a known outcome, a prediction is uncertain. It’s possible that the prediction will be wrong. This is different to ‘predicting’ a pattern in mathematics, where if we have solid evidence, the outcome is pre-determined and certain. In the statement above, providing a modifier “I think” in “I think it is going to rain…” expresses a possibility that it may rain, but it also may not.
How do we teach prediction to students, drawing on principles of statistics? One common strategy is to adapt questions that you might normally ask as descriptive questions (“How many students in our class walked to school today?”). You could ask students to anticipate the answer before collecting this information (“How many students in our class do we predict walked to school today?”), or ask questions that build on known data (“How many of the students in the class next door do we predict walked to school today?” or “How many students do we predict will walk to school tomorrow?”). In the early years, evidence is based on simple experience and observation. Over time, students are introduced to stronger forms of evidence using data.
Further reading
Makar, K. (2013). Predict! Teaching statistics using informal statistical inference. Australian Mathematics Teacher, 69(4), 34-40.
Even before they start school, young children use their experiences to make predictions about the world. Prediction is a natural and fundamental part of everyday life. This allows young children to begin applying prediction to their experiences from their first years in school.
Foundation
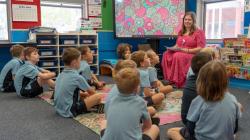
In Foundation, prediction can be embedded into the day by creating scenarios in which prediction is a natural experience. Asking questions like, “How many students do you predict will be present in our class tomorrow?” or “What time do you think we will finish school today?” In each instance, asking questions like “Why do you think that?”, “What is your prediction based on?” and “How sure are you?” encourage students to provide evidence and articulate predictions with uncertainty. The prediction about the number of students in class tomorrow would usually be articulated with less certainty than finishing time.
Foundation to Year 1
In Foundation and Year 1, students can predict how many counters they can hold in their hand, then go through a process of predicting, experimenting, counting to test their prediction, and using their count to predict their next handful. The second handful won’t be exactly the same as the first, which helps students to start to develop informal ideas around data, variability and sampling that will be further developed in later years. Experiments like this also encourage students to record or draw their predictions (invented recording, or inscriptions rather than formal tables or graphs). Students learn that their predictions improve as they go through this iterative process, helping them to informally build experience that having data strengthens a prediction. Building informal representation through invented recording further encourages the idea that showing others our evidence improves our ability to interpret data and increases the credibility of a prediction.
Year 1 to Year 2
In Years 1 and 2, students increase their awareness that predictions should be supported by evidence and expressed with uncertainty. These experiences can range from regularly asking simple questions in activities you’ve already planned (“How long do you think it will take us to count by twos to 30?”, “How many people do we predict will get their lunch at the canteen today?”) or targeted lesson sequences like Target Ball (in which students predict how far different types of balls will roll). Prediction in statistics has many similarities with inference in English, where students predict what will happen next in a story based on evidence presented so far. Therefore you may want to incorporate the same language in classroom activities.
Related sequences
Statistics: How many are we?
Students use everyday classroom experiences to investigate the story of their class data. They collect and record data about how many are in the class, and make informed predictions.
Statistics: How far goes my car?
Students make predictions, collect and record data about how a far a toy car might roll. They use the data they collect as evidence to refine subsequent predictions about their car.
Statistics: Climb, slide or swing?
Students investigate the problem of designing a class playground that is fun for everyone. They plan, collect, record and analyse survey data to conclude what playground features students would like.
Prediction adds purpose to many statistical investigations, helping students to see that analysing data can lead to meaningful insights about future outcomes. The broad statistical concepts and skills that students learn can be applied holistically and purposefully to questions and activities involving prediction throughout primary school. Students can apply these concepts and skills informally before they are encountered in the curriculum, and then consolidate the ideas as they are taught and assessed. For example, if students in Year 3 collect data on how far their classmates can jump, they can use that data in two ways: descriptively, by interpreting and drawing conclusions about how far students in the class jumped, and also to make predictions about how far students in other classes can jump. The second demonstrates the power of statistics to tell us about a situation for which we do not have data.
As students build experience with prediction in Years 3 to 6, teachers will notice their students’ capacity to make predictions improving based on the three fundamental elements of a prediction (making a claim beyond the data, using data as evidence, expressing uncertainty). Students will come to expect, and can be supported to learn, that a prediction is always made with evidence. Making predictions strengthens their awareness of and connections to ideas of variability, ‘typical’ data (informal idea of average), and representation, creating an emerging foundation of these ideas before they are formally introduced in the curriculum. This provides more students with opportunities to access the curriculum, because the concepts will be based on their experiences rather than remain abstract.
Related sequences
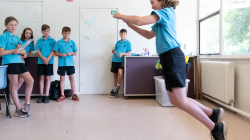
Statistics: How far can we jump?
Students investigate how far they can jump. They define their question, plan to collect and record data. They analyse this data and use it as evidence to answer the question.
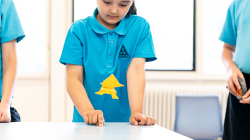
Statistics: Origami frogs
Students investigate how far an origami frog can jump. They define their question, plan, collect and record data. They analyse this data and use it as evidence to answer the question.
Statistics: Time to play
Students learn how to collect and analyse historical weather data, and use this data to make predictions about the best time to play outside at different times of the year.
Statistics: Loopy aeroplanes
Students make loopy aeroplanes using different designs. They collect, represent and analyse data to answer the question "Which loopy aeroplane design is best?”.
In secondary years, students apply their knowledge and skills about statistics to a range of increasingly complex problems. Problems that are framed in a real-world context often involve making informal inferences from collected data (a sample) to inform or predict broader situations involving data that has not been collected (a population).
Year 7 to Year 8
In Years 7 and 8 students build skills in statistical investigations and develop tools for representing and interpreting distributions, and apply these to contexts that allow for prediction or inference. Initially, students use inference about a context to report findings from statistical investigations and explain outcomes from probability experiments. Students are formally introduced to sampling and learn to distinguish samples from populations; they explore how samples behave and the implications on predictions made about a population. For example, students can explore how streaming services like Netflix use data from a sample of users with similar viewing habits to predict shows or movies that may be of interest, rather than analysing the viewing history of every user.
Year 9 to Year 10
In Years 9 and 10, students rely on their understanding of samples to make and critically analyse inferences to a population as they plan and conduct statistical investigations. They learn to estimate and predict outcomes based on information from data they collect, and increasingly understand the limitations and potential bias in their predictions as they experience constraints around collecting samples of data in the real world. They apply these experiences to critique claims in the media, being aware that different sampling methods can lead to different conclusions. For example, using their understanding of sampling in comparing groups, students can predict when a difference in means between two groups is likely due to chance.
Mathematical modelling that students experience in Years 9 and 10 often rely on creating linear or non-linear models from data, then making predictions from the model. For example, students may collect data comparing circumference to diameter of a collection of round objects they find in the world. Plotting their data on the axes of a scatterplot with a linear model allows them to make predictions about the relationship between circumference and diameter to predict unknown values.
Because prediction (inference) is the most powerful tool that statistics offers, it is critical that students have purposeful experiences with prediction throughout their schooling. By the end of the junior secondary years, students have a good foundation to build into more formal methods of making predictions and testing hypotheses in later years.
Related sequences
Mathematical modelling: Cracking codes
Students use mathematical modelling to explore codebreaking.

