Data is generated through observations, surveys, experiments or simulations. The two standard types of data that students learn about in school are categorical and numerical. It is beneficial for students to be working with both types of data from the beginning of primary school. Initially, students work with one variable (e.g. survey of how they get to school), but students also learn to work with multivariate data (e.g. also looking at how we travel to school in different weathers, or the distance from home to school) from a young age.
Students use two main forms of data in school: categorical and numerical.
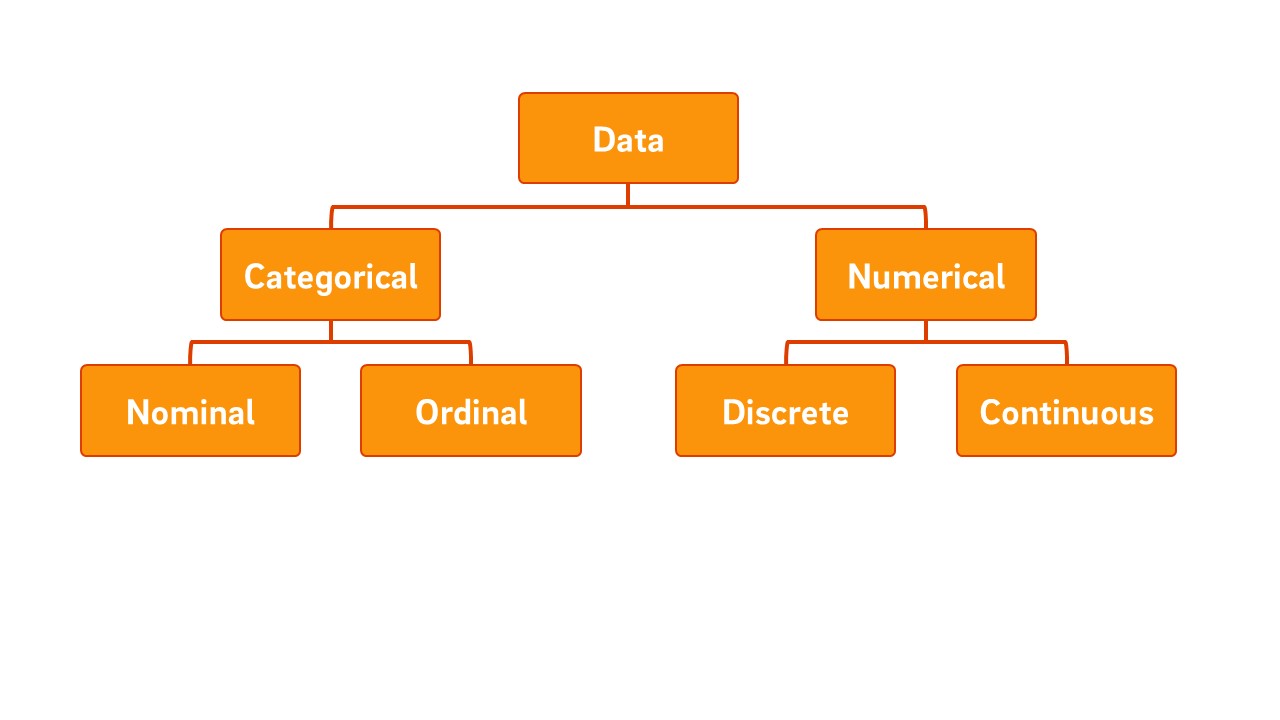
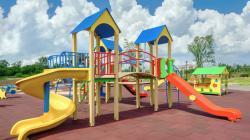
Categorical data is generally qualitative and sorted into categories with frequencies (number in each category). Categorical data is either nominal or ordinal. Nominal data ‘names’ things (e.g. types of playground equipment), whereas ordinal data has a meaningful order (e.g. days of the week). Numbers are sometimes used to ‘label’ rather than count or measure, so numbers can also be categorical data (e.g. brands 1, 2 and 3 in a taste test).
Numerical data has the expected characteristics of number. This data can be placed on a number line and used in calculations. Numerical data is either discrete or continuous. Discrete numerical data can be listed separately on a number line (e.g. ages of children in the school) and continuous numerical data is often rounded to do so (e.g. thickness of a book in centimetres rounded to the nearest tenth). Frequencies may be reported for discrete or grouped continuous data, but usually only if the number of different values or groups is small.
Data types affect how we collect, record, and represent data.
Collecting and recording data
Throughout school, students experience data collection through observations, surveys, probability experiments and simulations. Data can be collected by hand, with a digital device, or through automated processes.
As they collect data, students also need to record their data so it can be analysed to inform predictions and decisions. Collected data may be recorded individually with the source intact (e.g. who the data has been collected from, or the date a plant is measured) or combined as a summary (e.g. tally of how many times students roll a six on a die). Being able to identify the source of data may be important if, for example, students need to ensure that everyone in the class has been surveyed exactly once.
At the school level, most data is recorded as a list or in a table. As well as using a pre-existing recording sheet, it is recommended that students have some experiences creating their own recording methods as this creates an opportunity to clarify what the strengths and limitations are of various recording methods.
If you ask students how they will record their data, they may say “in a graph”. This lets you know they are not clear about the difference between recording and representing data. It is important that students understand that recording data is not the same as representing it. When students are frequently given data rather than collecting it themselves, they can confuse recording as representing data. If you see this misconception in your class, provide students with more experience collecting and representing data so that these processes are separated.
Representing data
Data types affect how data are represented. Categorical data is typically represented as column (or bar) graphs, picture graphs or pie charts. Numerical data is often graphed on a number line as a dot plot or increasingly complex forms such as stem-and-leaf or box plots. Noticing the shape of a distribution as symmetrical or skewed is relevant to numerical or ordinal data, whereas nominal data is described by the number of modes (values with highest frequency) rather than the shape, since the order of categories on the horizontal axis affects its appearance.
Increasingly, students are learning to represent and visualise data beyond standard graphs. For example, students may invent representations, use drawings or animations, create their own infographics, or use digital tools to represent and visualise data in new ways. Consider how cricket visuals help viewers recognise patterns, such as the placement of a bowler’s deliveries on the pitch or the directions of a batter's successful hits across the field over multiple overs. Non-standard visualisations often reveal patterns in data more effectively than a standard graph. If this cricket data was presented as a histogram, much of the meaning of the data would be lost.

At a glance
- Students work with two main types of data: categorical (nominal or ordinal) and numerical (discrete or continuous).
- Recording data is the process of capturing information in lists or tables. Recording should be kept distinct from representing data in graphs or visualisations to prevent confusion.
- Data representation depends on type: categorical data is often shown in bar, picture, or pie charts, while numerical data is shown on number lines or more complex plots, with non-standard visualisations sometimes revealing patterns more effectively.
In the early years, students begin to experience data through sorting, describing their sorting and developing one-to-one correspondence. These activities help them to become aware of how data can be organised into categories, that there is more than one way to organise data, and how data can be counted (informal idea of frequency). Young children are exposed to the language of statistics by describing categories and representing these categories with objects, drawings, visual displays and digital tools.
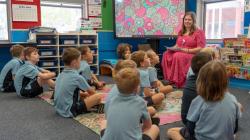
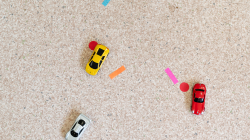
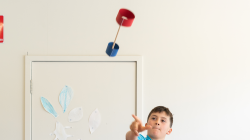
Students at this age start to learn about data collection through observation or surveys, with only a few pieces of data. For example, they may observe and compare how far two toy cars travel down a ramp. Through these observations, they may learn the value of measuring and record keeping. In contrast a survey is often used to capture opinions or preferences. Students find the social interactions of surveys exciting as they see themselves generating data. Collectively, these experiences give students an initial sense of the power of data to correspond to experiences they have had.
Data collection provides students with valuable learning opportunities that may not be apparent otherwise. For example, if students collect and record data from their classmates about their favourite playground activities, they may realise partway that they did not keep track of who they have and have not yet surveyed. Rather than addressing this issue upfront, having this experience first will reinforce the importance of using a system to keep track. Students will also initially rely on remembering the data they are collecting and not see that recording their data is valuable. Letting them experience the shortcoming of trying to recall data (or realising that data are harder to share if not recorded) can help young students better remember to record data they collect, and understand why recording is important.
It is beneficial for students’ early encounters with recording and representing data to be created rather than taught. This allows them to start with their own ideas for recording and representing as they are developing confidence (and while data collection is manageable). At this stage, efficiency is not the priority. Young students often choose to record data as a written narrative (Mia has lunch from home, Sanjay has lunch from the tuck shop…) or as individual drawings. Teachers can use questions to assist students to critique their own methods. For example, asking “How many people in our class brought their lunch to school today?” can help those who use a narrative method of recording become aware that it is less efficient than approaches such as tallies. For those who draw individual data points, they will be able to express how long it takes to collect and record—a learning experience they will not forget.
Related sequences
Statistics: How many are we?
Students use everyday classroom experiences to investigate the story of their class data. They collect and record data about how many are in the class, and make informed predictions.
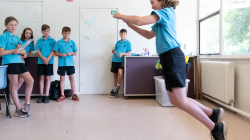
Statistics: How far goes my car?
Students make predictions, collect and record data about how a far a toy car might roll. They use the data they collect as evidence to refine subsequent predictions about their car.
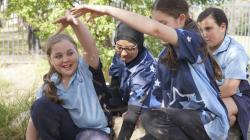
Statistics: Climb, slide or swing?
Students investigate the problem of designing a class playground that is fun for everyone. They plan, collect, record and analyse survey data to conclude what playground features students would like.
At a glance
- Students work with two main types of data: categorical (nominal or ordinal) and numerical (discrete or continuous).
- Recording data is the process of capturing information in lists or tables. Recording should be kept distinct from representing data in graphs or visualisations to prevent confusion.
- Data representation depends on type: categorical data is often shown in bar, picture, or pie charts, while numerical data is shown on number lines or more complex plots, with non-standard visualisations sometimes revealing patterns more effectively.
In upper primary school, students refine their approaches to data collection using observation and survey. They further build confidence and expand their repertoire as the data and phenomena they work with become more complex. They may begin to experience data collection through experiment and simulation, such as recording frequencies from rolling a die to compare with its expected probability.
Students learn the importance of asking well-designed questions to ensure they gather the responses they need. For example, when planning a class party, they might survey classmates about their favourite pizza toppings. When they first create surveys, students will often write “open” survey questions, where any response is recorded. This can lead to a very long list of different responses, few of which can be combined. This makes the outcome less useful (they can’t order 17 different pizzas for a class of 24). Having this experience can assist students to revise their survey questions to limit the number of choices available, which then facilitates collating class data (combining results across the class) and summarising responses into a manageable and useful set. It also raises questions of inclusion when appropriate, such as considering dietary requirements rather than just popularity when limiting pizza options.
At this stage, students work with a mixture of self-generated data and pre-existing data sets. Although the latter can be beneficial for developing fluency, it is important that students continue to have experiences working with data that they themselves generate. This will help them remember that decisions are made throughout data collection, representation, and analysis, that can influence the strength of evidence in their conclusions. Data is not objective as information gained from data depends on how and why the data was collected and represented.
Multiple opportunities with data collection, recording and representation, initiate students’ capacity to discuss and critique good and poor methods of collection, recording and representation, and the impact these methods have on the conclusions that students can draw from the data. These experiences strengthen students’ understanding of the benefit and efficiency of more conventional methods, as well as the potential in non-standard and technology-supported data collection (e.g. automated sensors, simulations), recording (spreadsheets, databases) and representation (infographics).
Related sequences
Statistics: How far can we jump?
Students investigate how far they can jump. They define their question, plan to collect and record data. They analyse this data and use it as evidence to answer the question.
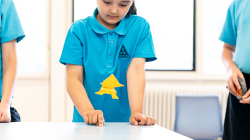
Statistics: Origami frogs
Students investigate how far an origami frog can jump. They define their question, plan, collect and record data. They analyse this data and use it as evidence to answer the question.
Statistics: Time to play
Students learn how to collect and analyse historical weather data, and use this data to make predictions about the best time to play outside at different times of the year.
Statistics: Loopy aeroplanes
Students make loopy aeroplanes using different designs. They collect, represent and analyse data to answer the question "Which loopy aeroplane design is best?”.
At a glance
- Students work with two main types of data: categorical (nominal or ordinal) and numerical (discrete or continuous).
- Recording data is the process of capturing information in lists or tables. Recording should be kept distinct from representing data in graphs or visualisations to prevent confusion.
- Data representation depends on type: categorical data is often shown in bar, picture, or pie charts, while numerical data is shown on number lines or more complex plots, with non-standard visualisations sometimes revealing patterns more effectively.
Throughout secondary years, students work with increasingly technical elements of statistics that strengthen the kinds of predictions that can be made with data. Methods of sampling, tools for analysing multivariate displays, and working with statistical models are all in service of conducting statistical investigations and making predictions.
Data types affect the kinds of calculations that can be made. For example, although mean, median and mode are all types of average, the mode (highest frequency) is typically reserved for categorical data, and mean and median are for numerical data. The ways that we represent and compare two variables also depend on data types. Scatterplots and line graphs on a coordinate plane are for comparing two numerical variables (such as temperature over time), whereas comparing two categorical variables often uses a two-way table or side-by-side column graphs. Stacked distributions, stem-and-leaf plots and pairs of box plots are common ways to represent and compare a numerical with a categorical variable.
At this stage, students also learn about sampling techniques and collect data through probability experiments and simulations. These are designed to overcome some of the shortcomings of small observations and surveys. They enable students to use sample data to make simple inferences beyond their sample to a larger population. Experiments and simulations provide a means to collect larger amounts of data, in order to observe and learn to analyse patterns from statistical models. For example, students can generate and test hunches about how likely an outcome is when adding the sum of two dice, including recognising patterns in their distribution that will later lead to learning about binomial models and normal curves.
As students gain knowledge about the world, it is important that they strengthen their awareness that decisions about data collection and representation impact the conclusions and predictions made from data. Knowing how data is influenced by human decisions helps students critically analyse statistics that they see in the media. By collecting and generating data themselves, young people develop awareness of complex issues behind data, such as accurate recording, survey design, bias and even privacy and ethics.
At a glance
- Students work with two main types of data: categorical (nominal or ordinal) and numerical (discrete or continuous).
- Recording data is the process of capturing information in lists or tables. Recording should be kept distinct from representing data in graphs or visualisations to prevent confusion.
- Data representation depends on type: categorical data is often shown in bar, picture, or pie charts, while numerical data is shown on number lines or more complex plots, with non-standard visualisations sometimes revealing patterns more effectively.