Variation distinguishes statistics from mathematics. Although statistics is taught in the mathematics curriculum, it is an entirely separate discipline. Where mathematics is used to describe consistent patterns in the world, statistics offers tools for explaining inconsistencies.
Variability is the degree of consistency (spread) in data; it is often used interchangeably with the term variation, which just indicates that things are not the same. Observing differences in the world around them allows students to become aware of variability—and to see that the world is not fully predictable. While probability helps us to capture and understand uncertainty, statistics gives us tools to understand variability, the reason for uncertainty.
Some variation can be partially explained by external factors. For example, the location might influence how students travel to school, or the seasons explain some of the reasons for weather changes. Other variation cannot be explained and we attribute it to randomness, sometimes referred to as the “noise” in data. Even random variation has recognisable patterns that helps us identify it.
Variability in data can be informally described or formally measured. As students go through school, they learn methods for observing patterns in data. They become aware of how variability in data can be anticipated, reduced, and measured, which lets them make use of those patterns for prediction. Understanding variability leads to the development of more advanced techniques to test hypotheses and provide evidence of how much different factors influence outcomes.
From a young age, students observe that the world is full of things that are the same and different. They notice that students travel to school in different ways (car, bus, bike, walking), that a ball doesn’t always land in the same spot when thrown, and that the weather changes. When students learn clapping patterns or create attribute trains, they become aware of patterns in variability, and can reproduce or describe these patterns and use them to predict what comes next.
A goal in the early years is to help students develop awareness and preliminary language for variation. As young students sort objects or survey their peers, encourage them to notice what is the same and different. Sorting objects in more than one way and asking different questions of their classmates can help them to become aware of and describe variability. For example, students may use counting (frequencies) to compare or describe how two sorts are different.
Learning about and describing variation can be done naturally and informally as young students go about their day, within their learning in mathematics or beyond in other content areas. They may notice that there are routines that remain the same each day (morning tea is always at 11:00) or that differ from one day to the next (we have HPE in the morning on Monday but in the afternoon on Wednesday). Encouraging children to explain what is the same or different will help them develop a foundation of learning about variation.
Related sequences
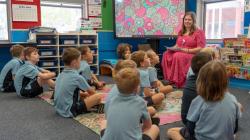
Statistics: How many are we?
Students use everyday classroom experiences to investigate the story of their class data. They collect and record data about how many are in the class, and make informed predictions.
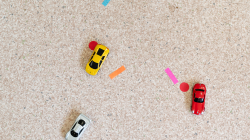
Statistics: How far goes my car?
Students make predictions, collect and record data about how a far a toy car might roll. They use the data they collect as evidence to refine subsequent predictions about their car.
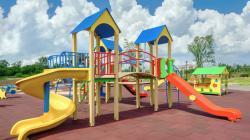
Statistics: Climb, slide or swing?
Students investigate the problem of designing a class playground that is fun for everyone. They plan, collect, record and analyse survey data to conclude what playground features students would like.
High variability can make our predictions less accurate. Therefore, recognising sources of variability can assist students in reducing some of the variation within their control. For example, measurement error is a common source of variability. When measuring the distance that an origami frog jumps, students may realise that there are inconsistencies in how the jumps are being measured. A subsequent reminder or discussion about improving measurement techniques and using common units will decrease variability from measurement error.
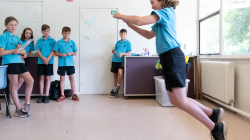
In the middle and upper primary years, students move from noticing variation to routinely anticipating and describing it in all aspects of a statistical investigation. They learn to anticipate that an open survey question will produce too much variation in responses or that they need to be consistent in how they collect data. These lessons are best learnt through experience. For example, if students apply inconsistent throwing techniques of their loopy aeroplane, they will see the resulting variability in the data by noticing that the data points are very spread out, making it difficult to interpret. It is important for them to see the connection between their actions and the resulting variation in the data. This connection makes their experience with data less abstract and helps them to explain where variability has come from in data. Learning ways that they can reduce variability and the impact of variation on interpreting data helps students to critically consider and improve the actions and choices that they make in collecting, recording and representing data.
Related sequences
Statistics: How far can we jump?
Students investigate how far they can jump. They define their question, plan to collect and record data. They analyse this data and use it as evidence to answer the question.
Statistics: Origami frogs
Students investigate how far an origami frog can jump. They define their question, plan, collect and record data. They analyse this data and use it as evidence to answer the question.
Statistics: Time to play
Students learn how to collect and analyse historical weather data, and use this data to make predictions about the best time to play outside at different times of the year.
Statistics: Loopy aeroplanes
Students make loopy aeroplanes using different designs. They collect, represent and analyse data to answer the question "Which loopy aeroplane design is best?”.
In the secondary years, students consolidate ideas about variability. They come to understand that variation is not wild variation—there are often limits and patterns in the variability of data. In describing variation in data, students move from qualitative to quantitative language, learning to measure variability in increasingly robust ways.
Year 7 to Year 8
In Years 7 and 8, students describe the spread of data in different contexts, often in combination with descriptions of features of a distribution. Their awareness of variation allows them to qualitatively compare the spread of data in two groups, and to initially quantify the variation of a dataset using the blunt measure of range (difference between maximum and minimum values). Students are introduced to the idea of sampling variation (observing that each sample is not the same) and why uncertain language is needed when making predictions from a sample. They explore and describe the effect of different sample sizes on sample variability. This raises awareness of how the extreme variability of very small samples can lead to poor interpretations and predictions from data.
Year 9 to Year 10
In Years 9 and 10 students further explore the nature of variation in samples, including describing variation in bivariate data through the idea of association. Their explorations with sampling variability allow them to become aware of expected variability and when variability is too high to make a prediction. Students explore patterns in random variability to challenge misconceptions about the predictability of randomness. For example, they can explore the likelihood of “hot hands” (streaks of positive free throws in basketball) by comparing the frequency of a streak of 5 successive free throws by a player in a basketball game to the same streak occurring in simulated random data based on the player’s average free throw rate. They learn to use more robust measures of variability such as five-number summaries (interquartile range, Q1-Q3) in boxplots to quantify comparisons of variation between groups.
By the end of Year 10, students have a good foundation of understanding how variability in data and samples of data work. They learn to connect the ideas of variation to the strength of a prediction, and observe limitations of small samples for making predictions.

