A key difference between mathematics and statistics is that in statistics, data is collected to understand a context. Data is not neutral; it derives its meaning from the context. There are many decisions to be made before data is collected and different ways to interpret data. All these elements—the purpose for the data collection, decisions made in what and how data was collected, interpretations in the analysis and the conclusions drawn—contribute to a data story.
A story has a beginning, a middle and an end. The beginning is the purpose or question being asked and the end explains the answer to the question. Like any good story, the middle is where the adventure is! It is the middle of the story that explains how data is collected, analysed and interpreted, including any challenges encountered and decisions made along the way.
Statistics is a discipline of interpreting and making predictions from data, recognising that there are many pathways to take and that different data, different kinds of analyses, and different representations tell different stories. It is important that the story told about the data is credible. In statistics, this means letting the reader in on the choices that were made and why. We also want students to realise that challenges are a normal part of the data story that they are creating. Making these challenges visible makes them normal and expected.
Throughout school, the powerful statistical idea that data tells a story creates coherence for learning statistics. One of the greatest challenges historically in teaching and learning statistics has been that statistical ideas are introduced, taught and assessed as separate entities. This has led to statistics receiving a rather poor reputation for being hard to understand. Seeing statistics through the perspective of a story creates purpose for learning statistical ideas and a sense of meaning for the statistical concepts and processes that we choose to employ along the way. It is an accessible idea that begins in Foundation to help young children experience data as a part of everyday life and continues to support increasingly complex problem solving throughout the learning journey.
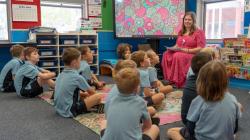
In Foundation to Year 2, students undertake short explorations and use data to tell many stories of themselves and their class. These explorations involve data from observations, experiments and surveys. Data can represent all kinds of things—number of people, contents of lunches, distance, preferences or whatever we want to find out about! Presenting these explorations as a story can fuel students’ imaginations to make their own data stories about the class or something that interests them.
The focus in Foundation to Year 2 is on the story of data and how each kind of data we collect tells us a different story about a situation we wonder about. For example, counting the number of people in the class at school today tells us about who is present and helps us to be aware that the number of people may or may not be the same as yesterday (a key foundation for variation, another powerful idea). It can also help us make predictions about who will be present tomorrow, knowing that the prediction isn’t certain.
Stories are also found in how we sort data. Different ways of sorting and comparing data (a form of data analysis) show different aspects of the data story. Changing the way the data is sorted and compared changes the story that is told through the data. Asking peers about their playground preferences creates a data story about the most popular equipment. Sorting these preferences by type of movement, such as climbing, swinging, or sliding, reveals which kinds of movement are most enjoyed by the class. This information can inform a playground design that includes fewer types of equipment overall, but more of each popular kind, ensuring everyone can have fun.
In Foundation to Year 2, students record data, including informal recording, to illustrate, remember and share their story. Challenges will come up that require decisions, which is all part of the story of the data. By telling the story of their data—with a beginning, a middle and an end—students are preparing to learn about statistical investigations and thinking about the evidence needed to tell the story.
Related sequences
Statistics: How many are we?
Students use everyday classroom experiences to investigate the story of their class data. They collect and record data about how many are in the class, and make informed predictions.
Statistics: How far goes my car?
Students make predictions, collect and record data about how a far a toy car might roll. They use the data they collect as evidence to refine subsequent predictions about their car.
Statistics: Climb, slide or swing?
Students investigate the problem of designing a class playground that is fun for everyone. They plan, collect, record and analyse survey data to conclude what playground features students would like.
Year 3 to Year 4
In Years 3 and 4, the story is enhanced by new statistical concepts, skills and processes. As students are introduced to the statistical investigation process and different types of data (numerical, categorical, ordinal), their story will develop more structure. The predictions they make will point to the data as evidence to strengthen the credibility of their story. Students become aware of many ways and sources for data collection, enrich their understanding of how data representations can be used to generate insights about data (considering multiple variables, their variability and distribution) and communicate findings. The size, sources, types and increased variability of data become more complex, creating sometimes conflicting and more nuanced stories about a situation. These enhanced stories offer opportunities for richer interpretations, stronger evidence, better predictions and improved reflection on choices made along the way.
Year 5 to Year 6
In Years 5 and 6, the data stories that students create bring together statistical ideas learnt through primary school to address increasingly complex problems. Students develop data stories that use statistical ideas holistically and with purpose, using more sophisticated methods, convincing evidence (including secondary data sources), multiple representations and a widening array of digital tools. The middle of the story becomes more critical as students take more responsibility for the design of investigations, such as posing statistical questions and being more aware of the need to logically align the whole statistical process—from the problem, question, data collection, analysis to the conclusion—recognising that their audience may critique or expect them to explain their choices.
Related sequences
Statistics: How far can we jump?
Students investigate how far they can jump. They define their question, plan to collect and record data. They analyse this data and use it as evidence to answer the question.
Statistics: Origami frogs
Students investigate how far an origami frog can jump. They define their question, plan, collect and record data. They analyse this data and use it as evidence to answer the question.
Statistics: Time to play
Students learn how to collect and analyse historical weather data, and use this data to make predictions about the best time to play outside at different times of the year.
Statistics: Loopy aeroplanes
Students make loopy aeroplanes using different designs. They collect, represent and analyse data to answer the question "Which loopy aeroplane design is best?”.
In Years 7-10, students take increasing responsibility for the story they tell with data. They learn increasingly robust techniques for using data as evidence to tell their data story. Students come to understand that being transparent to an audience about the decisions that they make in a statistical investigation enhances their story by making their conclusions more credible.
Year 7 to Year 8
In Years 7 and 8, students are introduced to new ways to quantify, represent and compare distributions. Being able to compare data opens new opportunities for the types of stories that can be told. For example, by comparing distributions, students can collect evidence to test hunches or inform conclusions about whether one group is different to another and by how much. Students learn to justify choices that they make and consider which tools are more useful to illustrate their story.
Year 9 to Year 10
In Years 9 and 10, students enhance and extend their techniques to plan, conduct and draw conclusions from statistical investigations. The power of prediction by using samples opens new opportunities for the kinds of stories that students can tell with data. For example, they can use their understanding of statistical tools to conduct blind taste tests between two brands of soft drink. The data they collect and interpret can tell a story of people’s preferences and how well their peers are able to predict brands based on taste. As students work more extensively with samples of data to make predictions beyond the data they have collected, they are able to understand the limitations in these stories that depend on how the data has been collected and analysed.

