Statistics: How far goes my car?
View Sequence overviewData is evidence for a prediction. Recording data allows us to refine our predictions.
Each group
Floor space
Materials to mark the length of car rolls, such as blocks, counters, rulers, different coloured sticky dots, chalk, and sticky notes
Each student
A toy car
Lesson
Revise: Making predictions is about thinking about what will happen in the future. In the last lesson we made predictions about how far our toy cars might roll.
Discuss some of the students’ observations from rolling cars the previous day, and specifically what made it hard to make accurate predictions about how far the car would roll. For example, students might comment on how forcefully the car was rolled, the direction that the car was rolled, or the surface on which the car was rolled.
Ask: How far did our toy cars roll? Were our predictions close?
Allow the students to share how far their cars rolled and who made accurate predictions.
Ask: How might we improve our predictions?
Allow students to share their initial thoughts, but leave the question open. Explain that today the students will investigate how they can improve their predictions.
Explain to students that to improve our predictions we need to first roll our cars more consistently. As a class, establish a ‘Car rolling protocol’. An example protocol might be: The toy car will always be rolled on the wooden floor and in the same direction. The “Goldilocks Principle” applies to the way that we roll our cars—the roll should not be too soft or too hard, the roll should be just right!
Pose the question: How can we improve our predictions? What might we do to show that our predictions are improving?
Convene the class in an open space. Divide students into groups of 3 or 4 students. Again, one person will be the ‘roller’ and one person the ‘predicter’. The other group member/s will look at how close each prediction is.
Make available materials for recording the length of car rolls, such as blocks, counters, rulers, different coloured sticky dots, chalk, and sticky notes. Explain that you have gathered some materials that might be helpful, but do not tell the students what they should do with these materials. The importance of recording data will emerge through the activity.
Allow students time to start predicting and rolling. At this point, students may not see it as necessary to record how far their car rolled.
Observe:
- Are any students using the last roll as their prediction, for example "Last time, the car stopped here, so I'll predict here. Now the car has stopped here, so I'll predict here."
- This is progress towards the learning goal of the lesson. They recognise the need to notice where the car stops to inform predictions.
- Are students recording data on their rolls to inform their predictions?
- This is the desired learning goal of the lesson; students are using multiple previous rolls to predict the next roll.
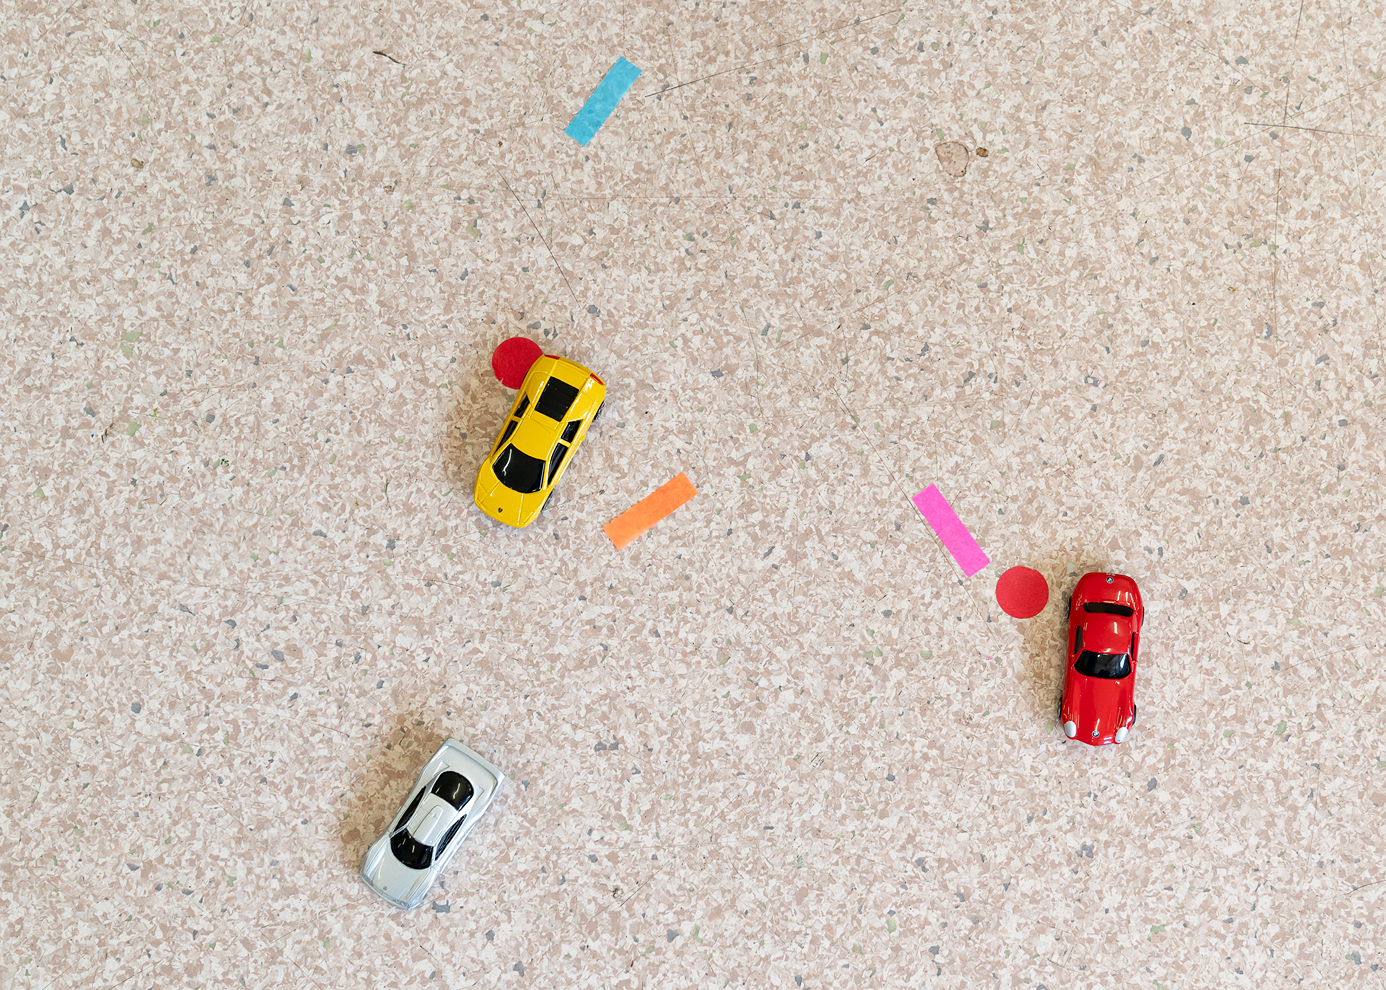
If students are not recording where the car previously stopped, ‘seed’ the idea of recording data with a group by marking the floor to show where the car stops each roll.
Through this activity, it is important that students recognise the need to record data so they can make informed predictions. These questions are designed to prompt students to think about the need to record data.
- What is the longest and shortest distance that your car has travelled? Where is your evidence?
- The longest and shortest rolls will inform predictions. Students cannot use this evidence if they have not recorded car roll data.
- Have your predictions become closer to the actual distance rolled, or further away?
- To see if their predictions are becoming more accurate, students need to see the data from the rolls and also know where they predicted their car might roll.
- Students will not be able to answer this question easily if they have not kept track of their prediction in some way and data which shows where the car rolled.
Seeding ideas

Our goal is for students to be active mathematical sense-makers who are learning to work like mathematicians. This means that the teacher needs to be responsive to students thinking and working. But what if students thinking and working is not heading in the right direction?
‘Seeding’ is a tool that teachers can use to guide and direct students’ thinking and working while maintaining them as authors of their learning. Seeding aims to develop students’ nascent ideas.
There are two kinds of seeding that you can use with your students:
- Looking for sprouts—As you observe your class in action, you may notice some students who are beginning to work towards the lesson’s learning goal. By asking these students to share their thinking and working with the class, you can ‘sprout’ the thinking and working of others in the class.
- Planting seeds—You can plant ‘seeds’ or ideas keep things moving. Only do this when students are unable to get going themselves. In this instance, you can seed by asking questions which steer students to think about recording their data by marking the floor, so that they can see how close their predictions are.
Select a group who are recording roll data (this may be your ‘seeded’ group). Conduct a Fishbowl activity so students can see how this group is working. Prompt students to watch for things that are working well and things that are not working so well.
After the Fishbowl, convene a class discussion.
Discuss:
- What things did you notice that were working well?
- Students may have been marking their predictions and also marking how far the car rolled.
- What things did you notice that were not working so well?
- You might first ask the group being observed this question so they can reflect on their own experience.
- Some issues may include using objects such as counters or blocks to record data which caused the car to stop if it hit them, or not distinguishing between the two data types.
Fishbowl

We use a Fishbowl here to give students the opportunity to see how others are recording data. The purpose of observing one group is not so everyone does exactly the same things as this group. Rather, it is to prompt students’ thinking about what they might do. For this reason, it is not important for the group being observed to be doing things correctly. In fact, it is helpful if they face some difficulties while they are working as this will prompt ideas for other students to try in their own group.
We use a Fishbowl here to give students the opportunity to see how others are recording data. The purpose of observing one group is not so everyone does exactly the same things as this group. Rather, it is to prompt students’ thinking about what they might do. For this reason, it is not important for the group being observed to be doing things correctly. In fact, it is helpful if they face some difficulties while they are working as this will prompt ideas for other students to try in their own group.
Ask students to meet in their small groups and think about how they would like to record their roll data. They also need to keep track of their predictions in some way. Remind them of the materials you have made available to mark how far the car rolls on the floor, including blocks, counters, rulers, different coloured sticky dots, chalk, and sticky notes.
When students have a plan, allow them time to repeat the activity.
When students are repeating their predictions and rolls this is an opportunity for you to notice whether students mark their prediction as well as mark how far their car rolled. Prompt students to think about why this might be useful data to have:
- How can you tell how close your car rolled to your prediction?
- How can you tell whether or not your predictions are getting closer?
Discuss how the markings that students are making are the data display of the group's car rolls. When students make a record of their data, they are able to share this data with other students who were not in their group. However, without this record, they only have the observations of the students who did the activity with them which cannot be shared with anyone else.
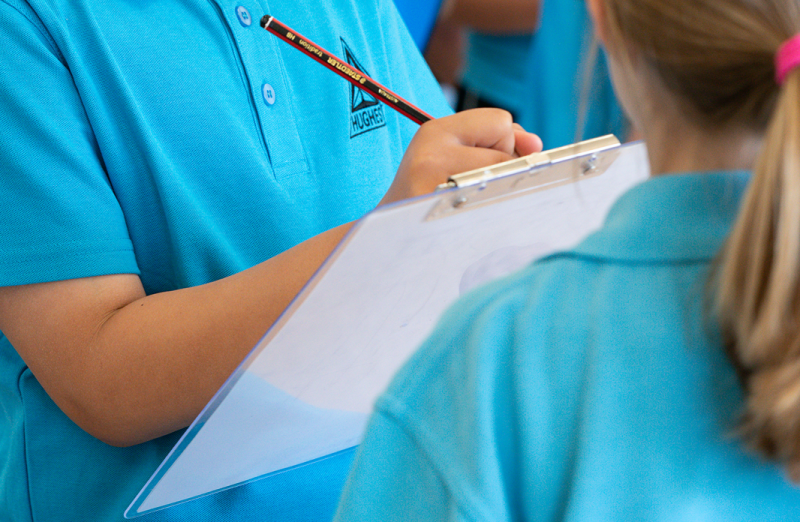
When they have predicted and rolled their car a few times, ask students to draw a picture of their data representation and/or take a photo of their displays for use in the following lesson.
Is it really data representation?

During the early years, it is important that students come to recognise the need to record data so that they can share their observations with others. Students’ early data markings may appear unconventional and are unlikely to conform to more formal conventions of data representation. However, these markings hold meaning and express student understanding of the data being collected.
When we give students the opportunity to represent data in their own, unconventional ways, their understanding of the purpose of recording data grows. Over time more conventional, agreed-upon ways to represent data emerge from these initial experiences.