Statistics: How far goes my car?
View Sequence overviewRecording data allows us to see the story that the data is telling us. We use this story to make predictions.
Each group
A toy car
Materials to make a car ramp, such as a large heavy piece of card and books to prop up the ramp
Materials to mark predictions and the length of car rolls, such as blocks, counters, rulers, different coloured sticky dots, chalk, and sticky notes
Lesson
Revise: We recorded data to see the story of how far our toys cars rolled. We used this data to make predictions about how far our cars might roll in the future.
So far, students’ predictions have been based on their experience and the evidence gathered of rolling cars on flat ground. This lesson introduces a variable—a ramp. Introducing this variable provides opportunity for students to collect data using a different context.
Show the students how to use the materials to make a car ramp.
Ask:
- How far will our car go if we roll our car down the ramp?
- Allow students to share their initial predictions. Students may predict how far they want their car to roll, rather than what is likely.
- Some students may not realise that the ramp will change the data, while others may anticipate a very big change in how far their car will travel.
- What evidence do you have to support your claim?
- Students might draw on what they know about their car on the floor, or they may have prior experience of using a toy car on a ramp.
Explain to students that we do not have experience with our toy cars on this ramp and so we need to collect some data. Divide the students into groups of 3-4 students. Provide each group with one car and the materials to make their own car ramp.
Allow the students to experiment with their car on their ramp for a while.
Convene a class discussion.
Discuss:
- What are some things you noticed about rolling your cars down the ramp?
- Students might comment on whether the cars go further or not on the ramp.
- Students will have rolled their cars down the ramp in different ways. Some will have just let their car go at the top of the ramp while others will have given it a big push.
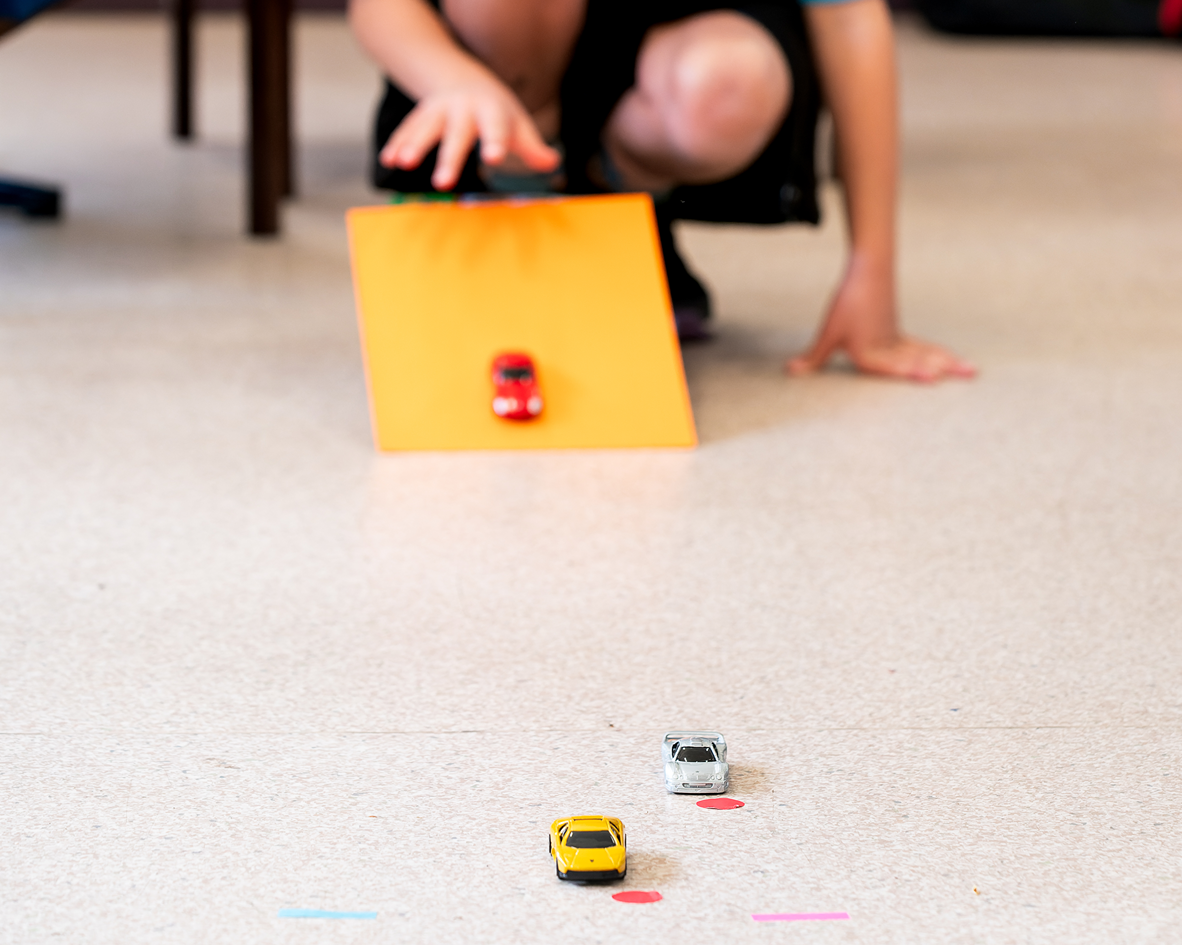
Establish a new ‘Car rolling protocol’ for rolling cars down the ramp. An example protocol might be: Hold the toy car at the very top of the ramp, in the centre of the ramp. Let the toy car go—don’t push it!
Pose the task: Make predictions about how far your car will roll using the ramp, then roll your car and see how close your prediction is.
Introducing informal statistical inference
Through this activity we are introducing students to informal statistical inference, as anticipating how far the car will roll down the ramp is beyond the data they have collected. We ask them to predict how far they think car might roll when they use the ramp. To do this, students draw from previous experiences of rolling the car on the floor and also consider how the variable of the car ramp might impact the data. Students express this prediction with uncertainty, as they have used their data to make an inference about what might happen, but they do not know for sure.
Through this activity we are introducing students to informal statistical inference, as anticipating how far the car will roll down the ramp is beyond the data they have collected. We ask them to predict how far they think car might roll when they use the ramp. To do this, students draw from previous experiences of rolling the car on the floor and also consider how the variable of the car ramp might impact the data. Students express this prediction with uncertainty, as they have used their data to make an inference about what might happen, but they do not know for sure.
Have students return to their groups and their car ramps. Make materials available for students to record the data on their car rolls.
Allow students time to predict and roll the car down the ramp. If students are not recording their car rolls remind them of the previous lesson and what they learnt.
The conversations that you have with groups in this session will be very important. The learning goal for the lesson should guide these conversations: Recording data allows to see the story that the data is telling us. We use this story to make predictions.
- Predict where you think the car will stop. What evidence do you base your prediction on?
- Students should be using the recorded data from all their previous rolls.
- Where do you think the car will stop this time? Why did your prediction change?
- It is likely that students’ predictions will change for each new roll. The new data recorded on the most recent rolls gives a fuller story of how far a car might roll in the future. This data is used to inform future predictions.
- Is your prediction the same each roll, or does it change? Why does it change?
- As more data is collected, students should be refining their predictions. The more data, the more informed predictions can be. It is important that students see that the data record is the source of authority, and not the teacher. This means that students can use the data as evidence to self-correct and as feedback to make further predictions to test.
Do students:
- Make predictions that are improbable—Prompt students to consider how they can use data from their previous rolls to find where the car might roll next.
- Use the ‘feel’ of the earlier rolls to inform their prediction—Prompt students to notice whereabouts the car rolled each time and what this might mean is likely next time.
- Refer to evidence to change their prediction—Prompt students to explain what the evidence tells them that made them change their prediction.
At the end of the session remind students that it is important to record the data displays that they have made. Take a photo of each group’s data display, that is, their ramp and the record data that is marked on the floor. Alternatively, students could draw a picture of the display.
Convene the whole class together for a class discussion. Display some of the photos/drawings of the data displays.
Discuss:
- Were your predictions the same each roll, or did they change? Why did your predictions change?
- As more data is collected, students should be refining their predictions. The more data, the more informed predictions can be.
- Select examples of students’ data displays. Let’s look at some of the data that we have collected. Based on the data in this display, where do you think the car might roll in each one?
- Ask students to justify their predictions based on the evidence provided in the display.
Discuss the story that the data is telling. In this instance, the data is telling two stories:
- How far a car is likely to roll when it goes down the ramp.
- Collecting data allows us to refine our predictions. The more data, the more informed predictions can be.
Explain: The more data we collect, the better our predictions become.