

Statistics: Origami frogs
View Sequence overviewThe distribution of data informs our predictions about what is likely and what is possible.
Whole class
Origami frogs PowerPoint
Each group
Metre rulers and measuring tapes
Four sticky notes
Each student
Students’ origami frogs made in Lesson 1
Two sticky notes
Lesson
Show students slide 11 of the Origami frogs PowerPoint which presents the PPDAC statistical investigation process.
Revise: We have our problem to investigate: How far can an origami frog jump?. We planned and collected our data. Now we need to represent and analyse the data.
Provide each student with four sticky notes. Ask them to record their frog’s jumps, one on each sticky note, and then stick their notes on the board.
Explain: We have collected so much data! We need to represent our data so we can make sense of it.
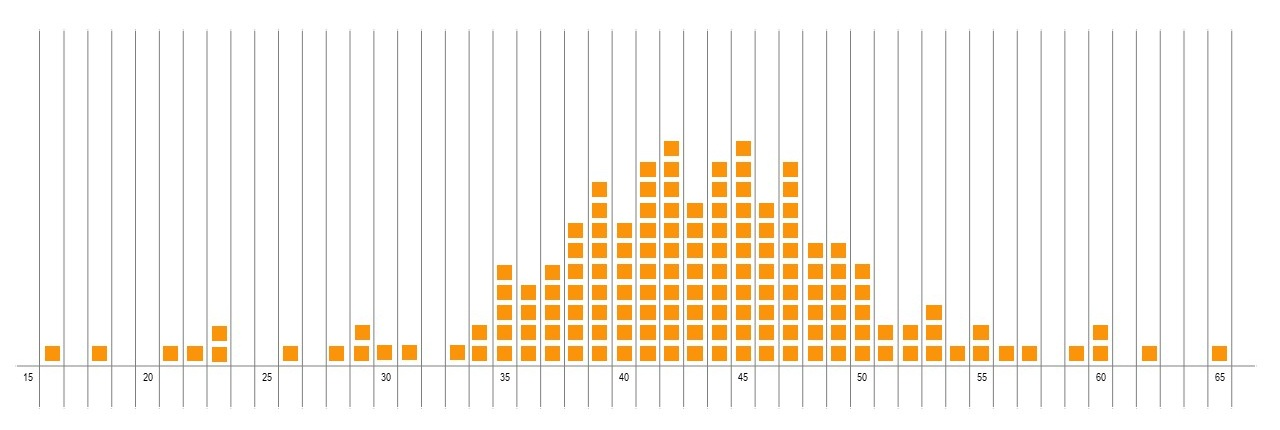
Order the sticky notes along a number-line (x-axis) so that it is easier to see the different distances jumped. Mark intervals of 1cm along the axis and place sticky notes in the correct place according to the measurements. Stack the sticky notes one above the other where measurements are the same.
Dot plots
A dot plot is a simple representation consisting of data points plotted as dots on a graph with an x- and y-axis. In this case, each sticky note (dot) represents the distance an individual frog has jumped. The dot sits somewhere along the number line, or x-axis. Recurrent values, such as the same distance jumped a number of times, are stacked on top of each other. This represents the frequency, or how often that distance was jumped.
A dot plot is a simple representation consisting of data points plotted as dots on a graph with an x- and y-axis. In this case, each sticky note (dot) represents the distance an individual frog has jumped. The dot sits somewhere along the number line, or x-axis. Recurrent values, such as the same distance jumped a number of times, are stacked on top of each other. This represents the frequency, or how often that distance was jumped.
Explain: We have created a dot plot of our frog data. Each dot represents a frog jump.
Discuss with the students what they notice. The following questions can be used to guide the discussion:
- Where do you see most of the frog jump data?
- Is the data symmetrical or more on one side than the other?
- How far is a typical jump for an origami frog in our class?
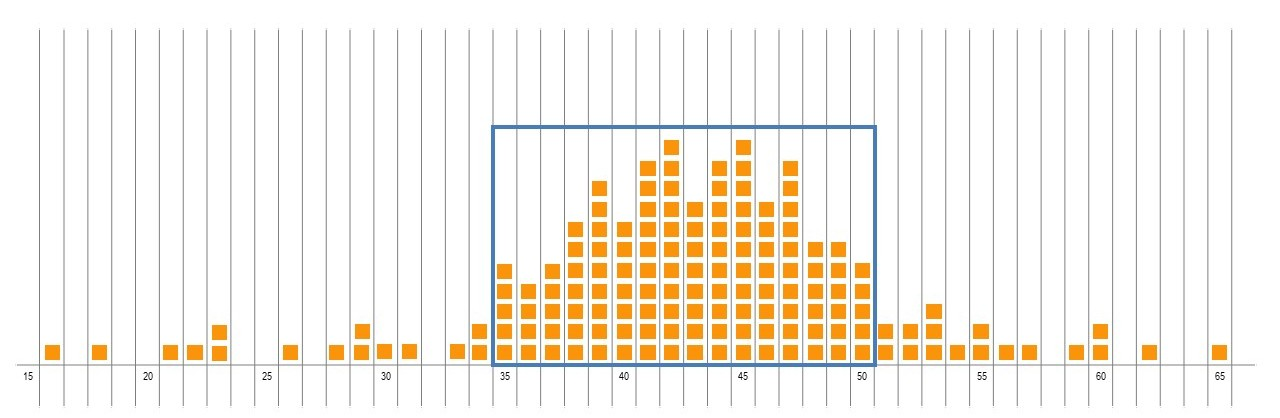
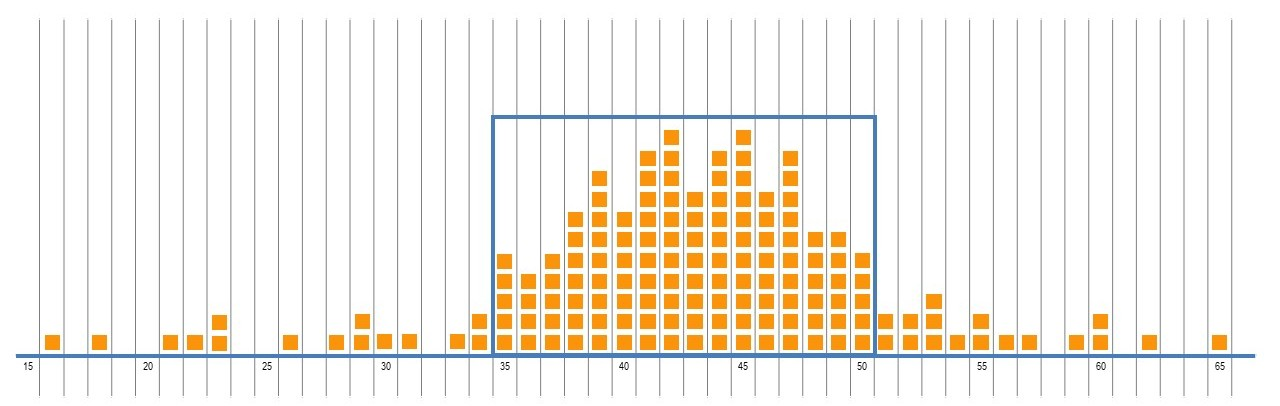
A hat plot is constructed through this class discussion. There are two parts to a hat plot: a crown that covers the middle half of the data, with brims on either side covering a quarter of data at each extreme.
Discuss:
- If I jumped my origami frog now, how far do you think it might jump?
- The distribution of data is used to inform predictions. Where the data clumps, indicates the centre of the data, or what is more typical. In this dataset, the range of data that falls in the centre will be over a number of intervals. If you jumped your origami frog now, it is likely that the jump will fall in this clump.
- Draw a rectangle around this centre clump. It should be approximately 50% of the data. This is the crown of the hat plot.
- Will my frog definitely jump in this centre clump?
- The data spreads further than this central clump. A frog is more likely to jump a distance that falls in this clump, but the spread of data should show that it is not certain that it will. It is also possible that a frog could jump beyond the current range of data.
- Draw a line on either side of the clump to indicate the spread of data. The number of data points each side should be similar, approximately 25% of the total dataset on each side. These lines form the brim of the hat. One side of the brim might be longer than the other, which shows that there is a great spread of data on one side compared to the other.
Have students return to their groups and continue jumping their frogs. Each group will need data from at least two additional frog jumps.
As students jump their frogs, ask them to make predictions as to how far they think it will jump. They should then measure each jump. Students should decide if the measurement falls within the crown or on the brim of the hat plot created from the class dot plot.
Hat plots
A hat plot is made up of two parts: the crown and the brim.
The crown of the hat is made up of a rectangle which shows the middle 50% of the data. The brim stretches out either side of this rectangle across the data. The brim takes up the remaining 50% of the data, with 25% of this data on either side of the crown. Drawing a hat plot over the dot data focuses student attention on the whole data set, rather than seeing it as separate data points. This helps to develop their understanding of data in terms of its pattern, shape and distribution. The centre of the data can be seen as a ‘clump’ of dots.
The hat plot that we use in this lesson is an informal hat plot. The crown does not need to have exactly 50% of the data, nor the brims have 25% on each extreme. Just a rough estimate is needed. The purpose is to draw students' awareness to the length of a typical frog jump, that is, a length that falls within the crown of the hat.
A hat plot is made up of two parts: the crown and the brim.
The crown of the hat is made up of a rectangle which shows the middle 50% of the data. The brim stretches out either side of this rectangle across the data. The brim takes up the remaining 50% of the data, with 25% of this data on either side of the crown. Drawing a hat plot over the dot data focuses student attention on the whole data set, rather than seeing it as separate data points. This helps to develop their understanding of data in terms of its pattern, shape and distribution. The centre of the data can be seen as a ‘clump’ of dots.
The hat plot that we use in this lesson is an informal hat plot. The crown does not need to have exactly 50% of the data, nor the brims have 25% on each extreme. Just a rough estimate is needed. The purpose is to draw students' awareness to the length of a typical frog jump, that is, a length that falls within the crown of the hat.
Have students return to their groups and continue jumping their frogs. As students jump their frogs, ask them to make predictions as to how far they think it will jump. Students measure each jump and decide if the distance jumped falls within the crown or on the brim of the hat plot.
Save the class data display as it is used in the next lesson.