Mathematical modelling: Cracking codes
View Sequence overviewData is used as evidence to inform predictions and decisions.
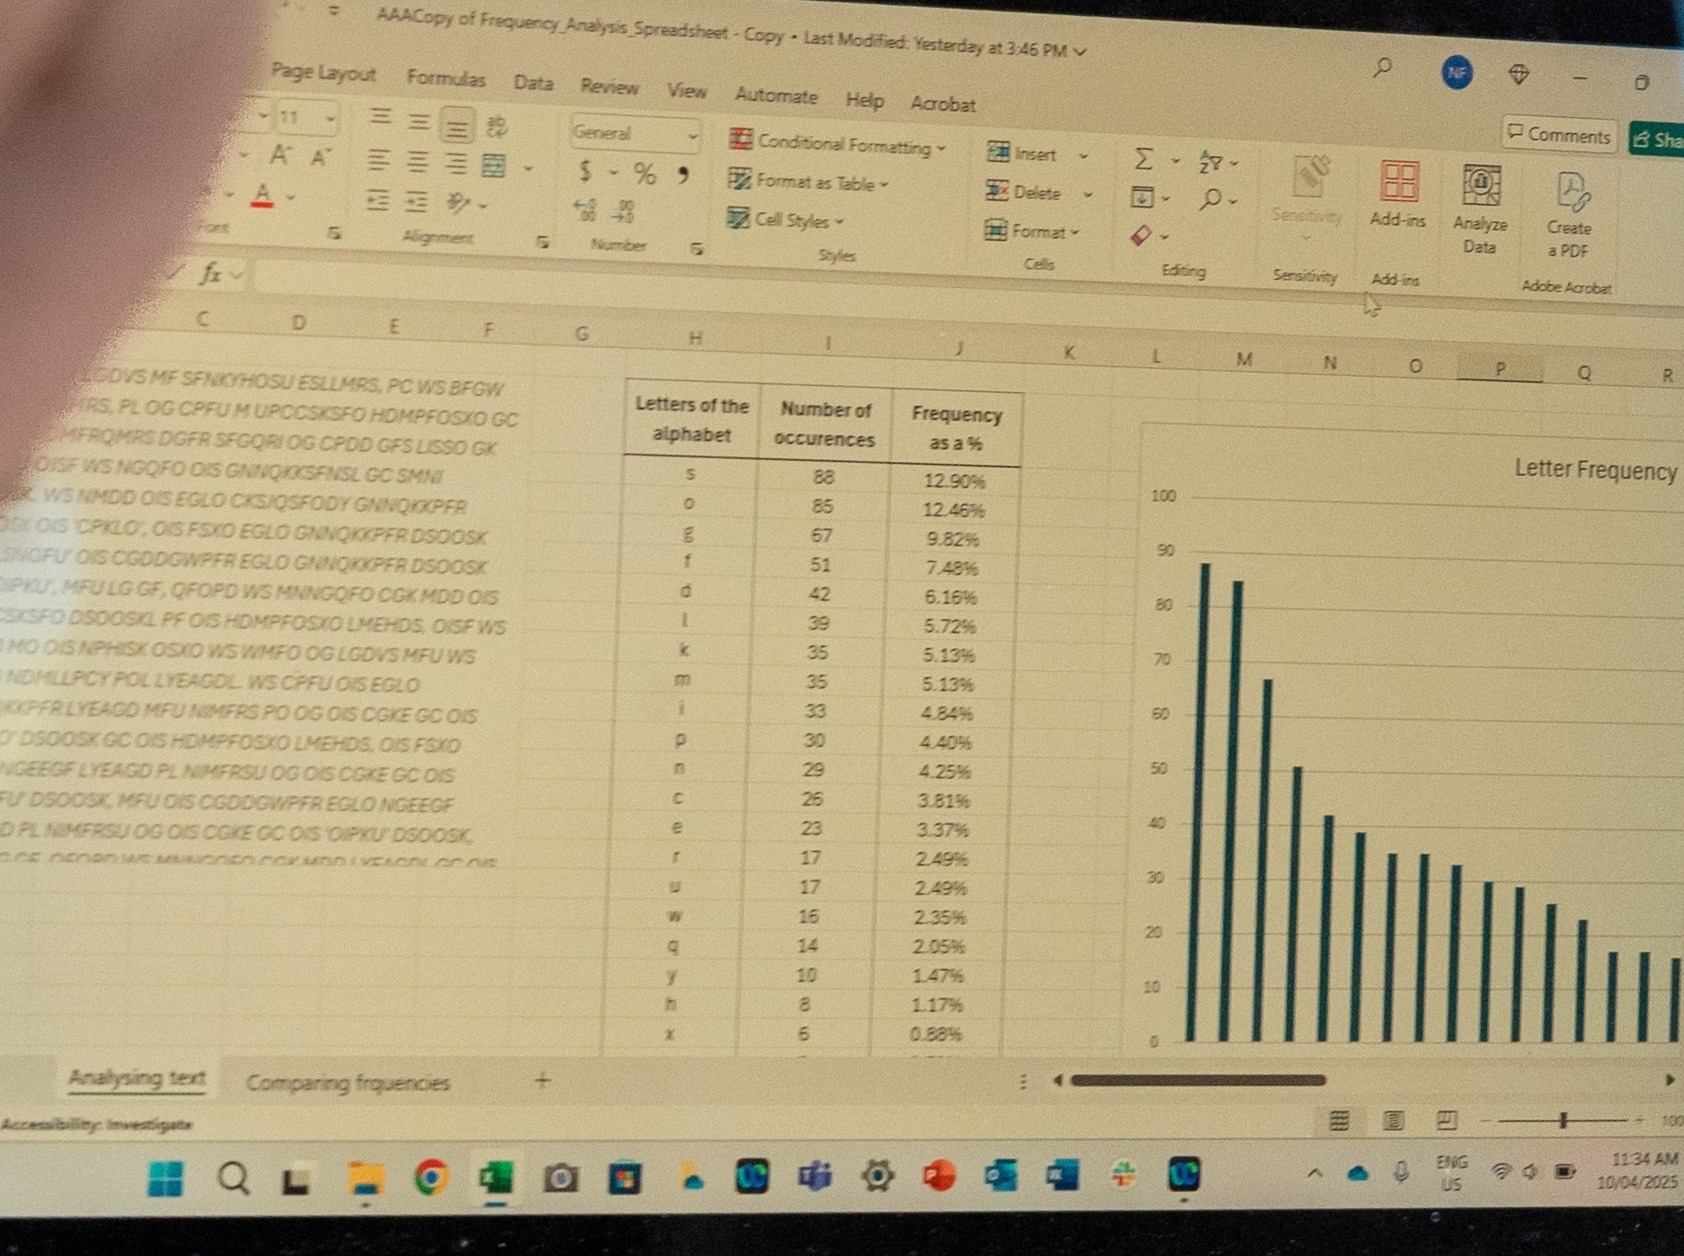
By analysing letter usage in text, we can determine the expected frequency of each letter.
Whole class
Cracking codes PowerPoint
Each group
Exploring frequency Student sheet
Access to computers or tablets
Access to spreadsheet software
A passage of text. The passage should be different for each group and can be accessed by students online (if students will be analysing the passage digitally), or printed by the teacher prior to the lesson (if students will be analysing the passage manually).
- If using computers, students might use Wikipedia pages on a subject of interest to them.
- If using printed pages, provide each group with different pages from a novel (for example).
Lesson
Show the students slide 3 of Cracking codes PowerPoint. Explain that students will use the process of mathematical modelling to determine methods that can be used to decipher substitution ciphers. Now that they have explored the problem in context, they need to formulate a mathematical problem.
Review the strategies students used to decipher the coded messages in Lesson 1.
Discuss: How might we use mathematics to help us decipher substitution ciphers like this more efficiently?
- In English text, letters appear with different frequencies. Comparing letter frequencies in a coded message to known letter frequencies in English text can help us to decipher substitution ciphers.
- For example, the letters e, t, and a are among the most common in English, so it is likely that they are mapped to the more frequently occurring symbols in a cipher.
Divide students into small groups and provide each group with a copy of Exploring frequency Student sheet. Ask the students to sort the letters of the English alphabet into four categories, based on how frequently they appear in English texts: most common, common, less common, least common. They can do this by cutting out the letters on the sheet and then sorting, or by writing letters into the appropriate space on the sheet.
Invite groups to share their strategies for sorting their letters and to justify their reasoning. Discuss the differences and similarities between the ways each group sorted their letters.
Discuss the different strategies students used to sort their letters. For example, the students may have used some text to inform their sort, or they may have used their instincts. Establish the need to collect data as evidence to inform their sorting.
Explain to students that each group will analyse a different passage of text to determine letter frequency. They will then use this data to create a column graph and compare their graph to their letter sort.
Provide each group with a passage of text. Ask students to determine how often each letter of the alphabet is used in the passage.
- For online text, the frequency of letters can be quickly calculated using the “Find” feature (Ctrl+F in Windows or Command+F on a Mac). Typing in a single letter into the search bar will count the number of times that letter appears.
- For printed text, students will need to manually count the number of occurrences of each letter.
Ask students to use spreadsheet software to create a column graph showing the frequency of letters obtained from their text analysis.
Have groups compare the results of their frequency analysis to their four categories of lessons. Allow groups time to recategorise any letters. They should keep track of any changes that they make and record reasons for why they choose to make these changes.
Using digital tools

Spreadsheet software (such as Microsoft Excel and Google Sheets) are useful tools that allow students to quickly and clearly organise and represent their data. It is important to teach students when it is appropriate to use these tools and how to use these tools well. Collating, organising and representing data is a very appropriate use of digital tools. Students will have had prior experiences collecting, organising and representing data using pen and paper and it is useful for them to see how computers can do this work efficiently.
The reality is, beyond the classroom, data collected from statistical investigations is rarely recorded or represented using only pen and paper. Nearly everything is done with computers. Datasets can be enormous and very messy, and we need digital tools to help us sort, clean, manage, represent and analyse data.
Digital tools also allow us to do things that are not possible manually and simplify other processes and tasks, such as changing between different representations to determine which representation is more or most appropriate, and to see the different stories that the representations tell.
Select students to present their frequency graph and letter sort to the class. Ask them to share why they chose to recategorise some letters in their sort after completing their text analysis.
Discuss:
- What did you notice about the frequency of letters in your passage compared to your letter sort? Does the frequency of any letters surprise you? Why?
- It is likely that the students will be surprised by the data. It is also important to note that this is just a small sample of text at this point and so unusual letter frequencies may be present.
- How are the results of each group similar?
- It is likely that there will be similarity between the letters that appear more frequently across the frequency graphs.
- How are the results from each group different?
- The relative frequency of letters will differ across the frequency graphs.
- Why might these similarities and differences exist?
- There will be differences evident because each group has used different passages of text. Each group has also used only a small sample of text.
- At this stage, we can observe differences in each group’s data. How could we adjust our approach to achieve greater consistency across groups? What strategies could help us collect more reliable and representative results?
- A larger amount of data is required. This can be achieved by analysing further text and combining the data from each small group to create a class dataset.
More data, greater accuracy?
Will more data lead to more accurate results? It depends!
More data can mean greater accuracy. Accessing large datasets means that we can learn from a broader and more diverse set of examples. This increases the opportunity to recognise patterns and relationships within the data. Additionally, a larger dataset helps minimise the influence of outliers, making it easier to identify separate genuine trends from random fluctuations.
However, just collecting a greater volume of data will not necessarily lead to more accurate results. For example, if you are analysing the typical frequency of letters in the English language, text written in German and Italian will pollute the results. For data to be helpful, it must be high-quality. This means that the data needs to be clean, relevant, and representative. It is better to have a smaller, high-quality dataset, rather than a large poor-quality dataset.