
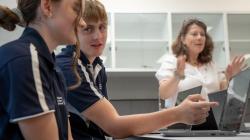
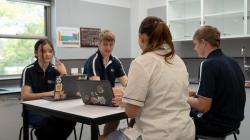
'Mathematical modelling: Screentime footprint' is one of our new teaching sequences for V9
- On the 'In this sequence' tab you'll find all the lessons in this sequence, a suggested implementation plan and curriculum alignment.
- The 'Behind this sequence' tab shows how key mathematical ideas develop over the sequence.
- Have you taught this sequence? Use the Feedback button to let us know how it went!
Lessons in this sequence
Lesson 1 • Comparing footprints
Students calculate rates to interpret CO₂ emission data by country and consider the extent to which Australia generates CO₂ emissions.

Lesson 2 • Looking to the future
Students develop a linear model to predict the future digital download behaviour of individuals and calculate the impact on CO₂ emissions.
Lesson 3 • Changing downloads
Students create linear graphs to model the increase in the size of common apps, make predictions about the size of these apps in the future and evaluate the effectiveness of their predictions.

Lesson 4 • My screentime footprint
Students investigate their own carbon footprint based on average rates and determine the most effective method for reducing their CO₂ emissions.
The Australian Academy of Science supports and encourages broad use of its material. Unless indicated below, copyright material available on this website is licensed under a Creative Commons Attribution-NonCommercial-ShareAlike 4.0 International (CC BY-NC-SA 4.0) licence.
Curriculum and syllabus alignment
Year 8
Students use mathematical modelling to solve practical problems involving rates. They use mathematical modelling to solve problems using linear relations, interpreting and reviewing the model in context. Students graph linear relations and solve linear equations with rational solutions, graphically and algebraically. They make and test conjectures involving linear relations using digital tools. Students conduct statistical investigations and explain the implications of obtaining data through sampling. They analyse and describe the distribution of data.
Algebra
Graph linear relations on the Cartesian plane using digital tools where appropriate; solve linear equations and one-variable inequalities using graphical and algebraic techniques; verify solutions by substitution
Use mathematical modelling to solve applied problems involving linear relations, including financial contexts; formulate problems with linear functions, choosing a representation; interpret and communicate solutions in terms of the situation, reviewing the appropriateness of the model
Measurement
Recognise and use rates to solve problems involving the comparison of 2 related quantities of different units of measure
Use mathematical modelling to solve practical problems involving ratios and rates, including financial contexts; formulate problems; interpret and communicate solutions in terms of the situation, reviewing the appropriateness of the model
Statistics
Plan and conduct statistical investigations involving samples of a population; use ethical and fair methods to make inferences about the population and report findings, acknowledging uncertainty
In this sequence, students explore how everyday digital behaviours contribute to CO2 emissions and how mathematics can help us understand and respond to this issue. They begin by examining international comparisons, then look at how Australia’s digital use is changing, investigate the growth of app file sizes, and finally calculate their own digital CO2 footprints. Across the lessons, students are encouraged not just to analyse data, but to think critically about the choices individuals and communities can make to reduce emissions. The sequence highlights mathematics as a decision-making tool, connecting classroom learning with questions of environmental responsibility.
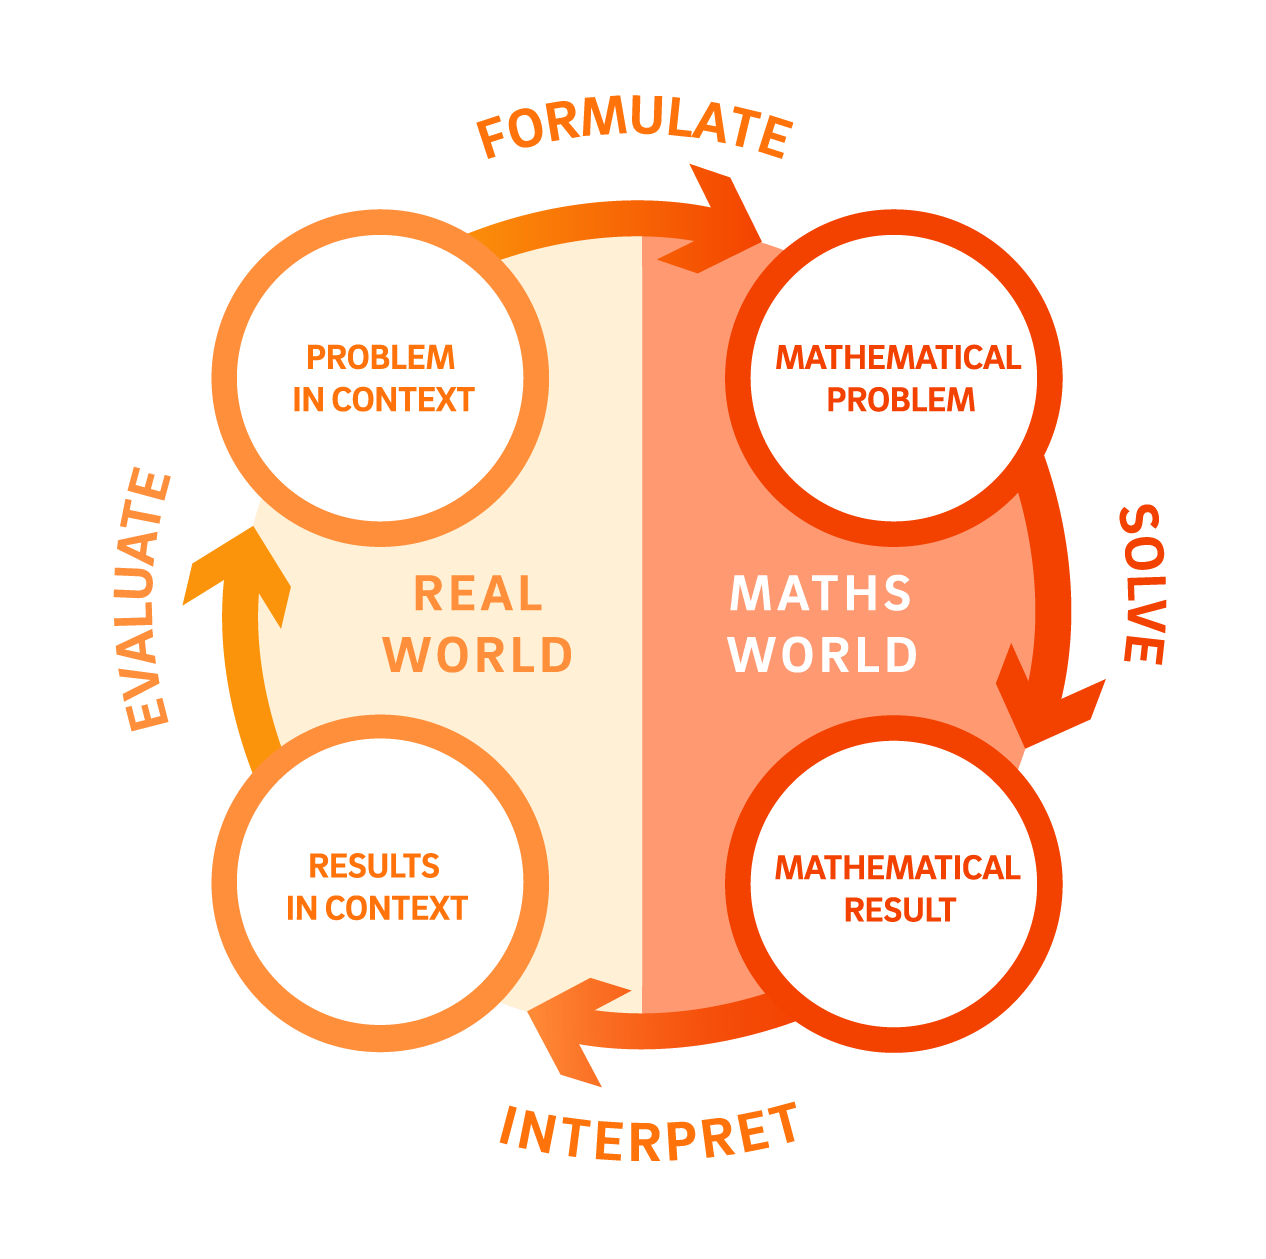
The process of mathematical modelling in this sequence
Formulate
Students are introduced to CO2 emissions data by country and consider how raw totals can be misleading without accounting for population. They identify the need to calculate rates, and consider how mathematics might help them understand Australia's emissions relative to other countries.
Solve
Students calculate CO2 emissions per person for each country in the dataset. They then develop linear models to predict future trends in data downloads, using Desmos to fit lines to real data and generate equations. They also calculate the CO2 emissions associated with their own digital activity.
Interpret
Students use their models to make predictions: how Australia's download data will grow, how app sizes will change over time, and what proportion of their own annual CO2 emissions comes from online activity.
Evaluating
Students consider the strengths and limitations of their models, including the effect of assumptions about emissions rates, the appropriateness of a linear model for the data, and what actions might meaningfully reduce their digital carbon footprint.

'Mathematical modelling: Screentime footprint' is one of our new teaching sequences for V9
- On the 'In this sequence' tab you'll find all the lessons in this sequence, a suggested implementation plan and curriculum alignment.
- The 'Behind this sequence' tab shows how key mathematical ideas develop over the sequence.
- Have you taught this sequence? Use the Feedback button to let us know how it went!