

Teaching sequences for AC V9
Explore our new mathematics sequences with integrated professional learning. Flexible and adaptable to any classroom setting. Online, downloadable and free.
Filter Teaching Sequences


Statistics: Time to play
Students learn how to collect and analyse historical weather data, and use this data to make predictions about the best time to play outside at different times of the year.
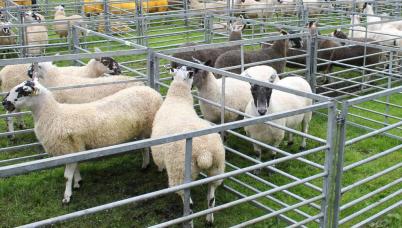
Algebra: Pens and patterns
Students investigate agricultural show pen designs by building, testing and comparing connected square-pen arrangements. They develop step-by-step and relational rules for growing patterns, including rules with rows and columns, then apply these rules to compare panel use and cost to justify an efficient show design.
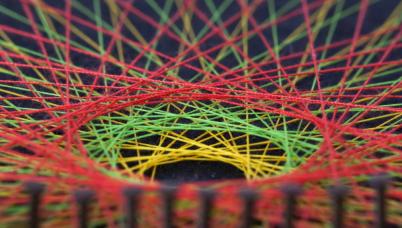
Number: The secret patterns behind string art
Students use a string art image to explore the Cartesian plane and directed numbers. They start by drawing the design by hand, discovering a numerical pattern in the coordinates of every line, then move to Scratch, where they learn to code that pattern as a loop.
Statistics: Loopy aeroplanes
Students make loopy aeroplanes using different designs. They collect, represent and analyse data to answer the question "Which loopy aeroplane design is best?”.

Algebra: Euler’s dice
Students classify prisms and pyramids, derive algebraic rules for faces, vertices, and edges, and discover Euler’s rule for polyhedra. The sequence is built around a game designer who needs custom dice for the world’s most significant lucky and unlucky numbers.
Mathematical modelling: Cracking codes
Students use mathematical modelling to explore codebreaking.

Mathematical modelling: Screentime footprint
Students use linear models to investigate how screen time contributes to carbon dioxide emissions. They consider their personal digital footprint and make predictions about future emissions.
Mathematical modelling: Playing with fire
Students use data to (re)create two rules of thumb and apply mathematical models to predict the rate of spread of bushfires.
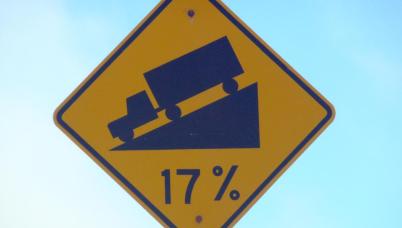
Mathematical modelling: The steepest slopes on Baldwin St
Using the context of Baldwin Street, the world’s steepest residential street, students measure and represent steepness in multiple ways, connect gradient to tangent, and consider how mathematical information is communicated to real audiences.
Statistics: Time to play
Students learn how to collect and analyse historical weather data, and use this data to make predictions about the best time to play outside at different times of the year.
Algebra: Pens and patterns
Students investigate agricultural show pen designs by building, testing and comparing connected square-pen arrangements. They develop step-by-step and relational rules for growing patterns, including rules with rows and columns, then apply these rules to compare panel use and cost to justify an efficient show design.
Number: The secret patterns behind string art
Students use a string art image to explore the Cartesian plane and directed numbers. They start by drawing the design by hand, discovering a numerical pattern in the coordinates of every line, then move to Scratch, where they learn to code that pattern as a loop.
Statistics: Loopy aeroplanes
Students make loopy aeroplanes using different designs. They collect, represent and analyse data to answer the question "Which loopy aeroplane design is best?”.
Algebra: Euler’s dice
Students classify prisms and pyramids, derive algebraic rules for faces, vertices, and edges, and discover Euler’s rule for polyhedra. The sequence is built around a game designer who needs custom dice for the world’s most significant lucky and unlucky numbers.
Mathematical modelling: Cracking codes
Students use mathematical modelling to explore codebreaking.
Mathematical modelling: Screentime footprint
Students use linear models to investigate how screen time contributes to carbon dioxide emissions. They consider their personal digital footprint and make predictions about future emissions.
Mathematical modelling: Playing with fire
Students use data to (re)create two rules of thumb and apply mathematical models to predict the rate of spread of bushfires.
Mathematical modelling: The steepest slopes on Baldwin St
Using the context of Baldwin Street, the world’s steepest residential street, students measure and represent steepness in multiple ways, connect gradient to tangent, and consider how mathematical information is communicated to real audiences.