
'Mathematical modelling: What makes us happy?' is one of our new teaching sequences for V9
- On the 'In this sequence' tab you'll find all the lessons in this sequence, a suggested implementation plan and curriculum alignment.
- The 'Behind this sequence' tab shows how key mathematical ideas develop over the sequence.
- Have you taught this sequence? Use the Feedback button to let us know how it went!
Lessons in this sequence
Lesson 1 • Measuring happiness
Students consider factors they believe may influence happiness and consider how we might measure happiness numerically.

Lesson 2 • Does wealth make us happy?
Students use scatterplots to explore the relationship between wealth and happiness for different countries around the world.

Lesson 3 • A closer look at wealth
Students use lines of good fit and regression lines to model relationships in data, interpret gradients and intercepts, and make predictions in context.

Lesson 4 • The wealth and happiness of continents
Students compare scatterplots across continents to examine how relationships vary between subgroups and how context affects interpretation.

Lesson 5 • What else makes us happy?
Students use $r^2$ to compare models and evaluate whether observed relationships support prediction, explanation, or causal claims.

The Australian Academy of Science supports and encourages broad use of its material. Unless indicated below, copyright material available on this website is licensed under a Creative Commons Attribution-NonCommercial-ShareAlike 4.0 International (CC BY-NC-SA 4.0) licence.
Curriculum and syllabus alignment
Year 10
Students plan and conduct statistical investigations involving bivariate data. Students represent the distribution of data involving 2 variables, using tables and scatter plots, and comment on possible association.
Statistics
Construct scatterplots and comment on the association between the 2 numerical variables in terms of strength, direction and linearity
Construct two-way tables and discuss possible relationship between categorical variables
Plan and conduct statistical investigations of situations that involve bivariate data; evaluate and report findings with consideration of limitations of any inferences
In this sequence, students use mathematical modelling to conduct statistical analysis, with a specific focus on exploring relationships between variables using a digital system, CODAP, for efficient calculation. The use of digital systems for statistical analysis allows for calculations to be completed with speed and accuracy, and means that more attention can be given to the interpretation and discussion of statistical results. CODAP has been chosen in this instance as it is free, relatively easy to use, supports a wide range of statistical calculations and models, and is designed for learners.
This teaching sequence supports students to appreciate the usefulness of statistical modelling for understanding the lives and experiences of a diverse range of people and communities, and highlights the rich connections between Mathematics, Humanities and Social Sciences, and Digital Technologies.
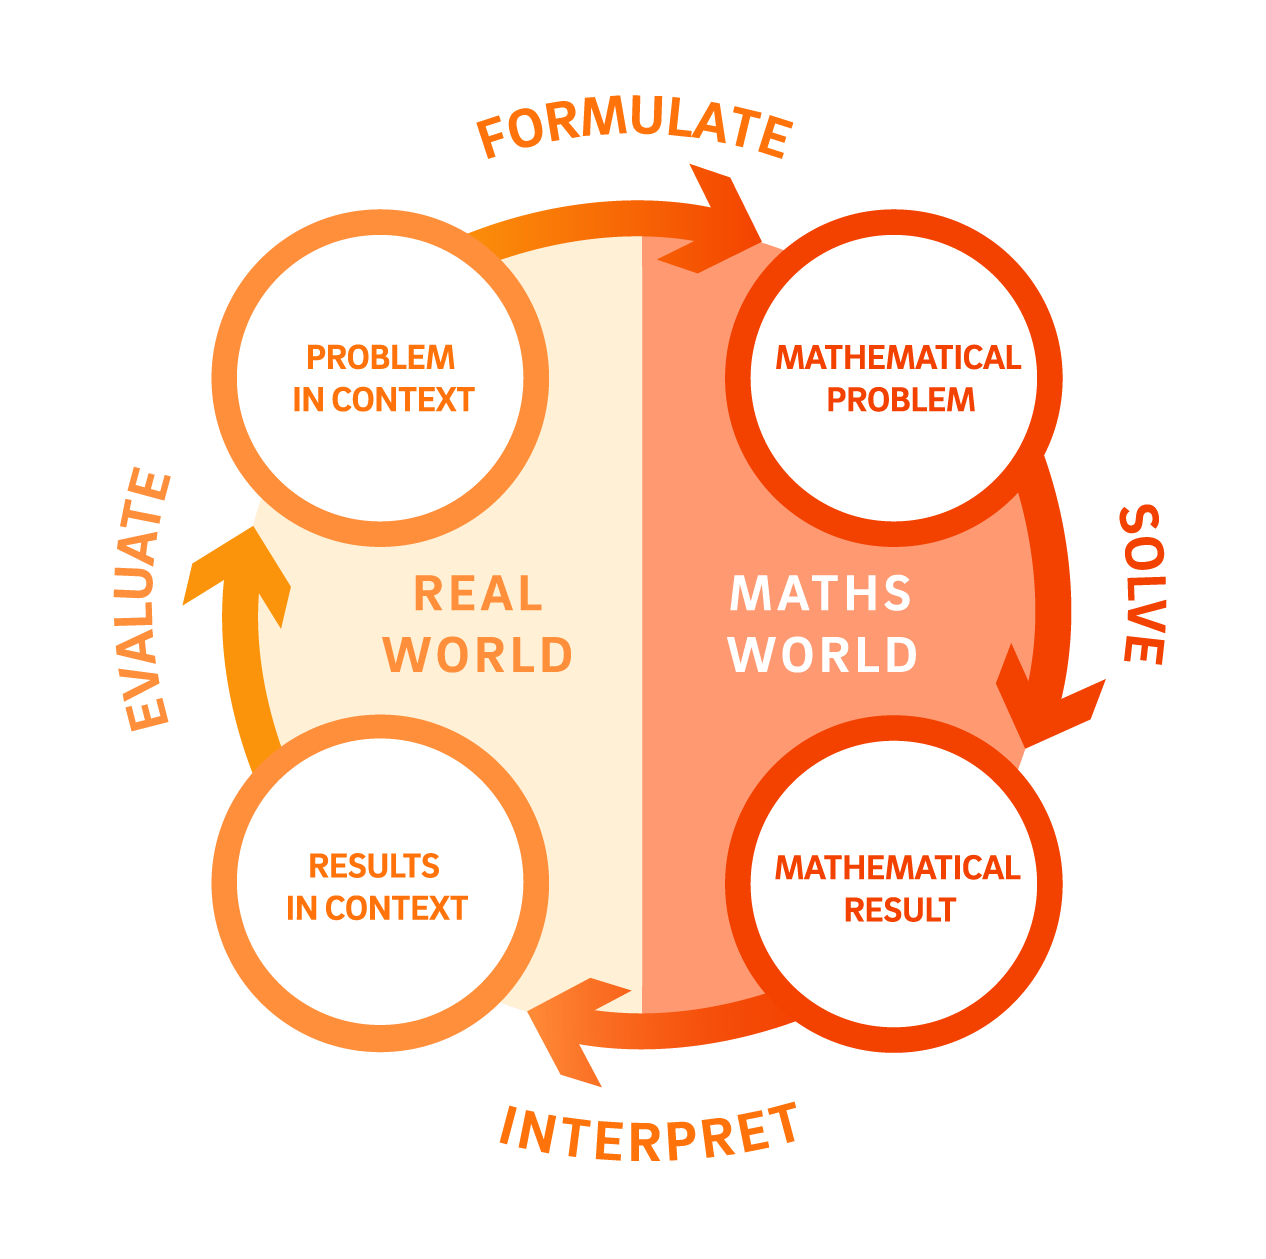
The process of mathematical modelling in this sequence
Formulate
Students begin with the question "What makes people happy?" They brainstorm factors that might influence happiness, consider how happiness could be measured numerically, and explore how researchers attempt to do this at a global scale through tools like the Cantril Ladder. They identify variables to investigate and consider how data for these variables are collected.
Solve
Students work with secondary data in CODAP, constructing scatterplots to explore relationships between happiness and variables such as GDP, health, education, and access to clean water. They draw lines of good fit by hand, generate least squares regression lines, and calculate and record $r^2$ values. They use regression equations to make predictions through interpolation and extrapolation.
Interpret
Students interpret the gradient and $y$-intercept of regression lines in context, describe relationships in terms of direction, strength, and linearity, and compare models across continents and across different predictor variables. They use $r^2$ to evaluate how well each model explains the variation in happiness.
Evaluate
Students consider the limitations of their models, including what interpolation and extrapolation can and cannot tell us. They examine the distinction between correlation and causation, identifying where a causal explanation is reasonable and where the data support only a correlation claim.

'Mathematical modelling: What makes us happy?' is one of our new teaching sequences for V9
- On the 'In this sequence' tab you'll find all the lessons in this sequence, a suggested implementation plan and curriculum alignment.
- The 'Behind this sequence' tab shows how key mathematical ideas develop over the sequence.
- Have you taught this sequence? Use the Feedback button to let us know how it went!