
'Mathematical modelling: Playing with fire' is one of our new teaching sequences for V9
- On the 'In this sequence' tab you'll find all the lessons in this sequence, a suggested implementation plan and curriculum alignment.
- The 'Behind this sequence' tab shows how key mathematical ideas develop over the sequence.
- Have you taught this sequence? Use the Feedback button to let us know how it went!
Lessons in this sequence
Lesson 1 • Bushfire behaviour
Students sort diagrams of fire simulations (non-typical data representations) to determine how temperature, humidity and wind influence fire behaviour.

Lesson 2 • The influence of wind
Students use data to generate a rule of thumb for estimating the impact of wind on fire behaviour.

Lesson 3 • Rate of spread estimates
Students compare the rate of spread values generated using a rule of thumb with those produced by a formal mathematical model.

Lesson 4 • The influence of topography
Students use data to generate a rule of thumb estimating the impact of topography on fire behaviour.

Lesson 5 • Evacuate!
Students apply their learnings to determine when two small towns should evacuate in response to an approaching fire.

Curriculum and syllabus alignment
Year 9
Students use mathematical modelling to solve problems involving change in financial and other applied contexts, choosing to use linear and quadratic functions. They use mathematical modelling to solve practical problems involving direct proportion, ratio and scale, evaluating the model and communicating their methods and findings.
Students compare and analyse the distributions of multiple numerical data sets, choose representations, describe features of these data sets using summary statistics and the shape of distributions, and consider the effect of outliers. Students explain how sampling techniques and representation can be used to support or question conclusions or to promote a point of view. They design and conduct experiments or simulations for combined events using digital tools.
Algebra
Use mathematical modelling to solve applied problems involving change including financial contexts; formulate problems, choosing to use either linear or quadratic functions; interpret solutions in terms of the situation; evaluate the model and report methods and findings
Measurement
Use mathematical modelling to solve practical problems involving direct proportion, rates, ratio and scale, including financial contexts; formulate the problems and interpret solutions in terms of the situation; evaluate the model and report methods and findings
Statistics
Represent the distribution of multiple data sets for numerical variables using comparative representations; compare data distributions with consideration of centre, spread and shape, and the effect of outliers on these measures
Choose appropriate forms of display or visualisation for a given type of data; justify selections and interpret displays for a given context
Plan and conduct statistical investigations involving the collection and analysis of different kinds of data; report findings and discuss the strength of evidence to support any conclusions
In this sequence, students use mathematical modelling to determine when two small towns should evacuate in response to an approaching bushfire. Drawing on data from real and simulated fires in dry eucalypt forests, they investigate how weather conditions and topography influence the forward rate of spread. Using this data, students (re)create two commonly used rules of thumb:
- The forward rate of spread in dry eucalypt forests is approximately 10% of the average 10m open wind speed (the wind speed measured at 10 m above ground level in an open area) (Cruz & Alexander, 2019).
- The rate of spread of a bushfire doubles for every 10° of upward slope (McArthur, 1968).
Students are then introduced to mathematical equations used to model fire behaviour and compare the results to those generated by the rules of thumb. Through this comparison, they come to see that mathematical models offer greater accuracy in predicting the rate of spread of bushfires.
A key component of this sequence is the use of an Excel workbook. It enables students to efficiently represent data and perform calculations using more complex equations. By automating these processes, students can shift their focus from computation to critically analysing the data and comparing the accuracy of results generated by different methods.
This sequence has strong links to Science and can be used alongside the Science Connections sequence, Bushfire and ice.
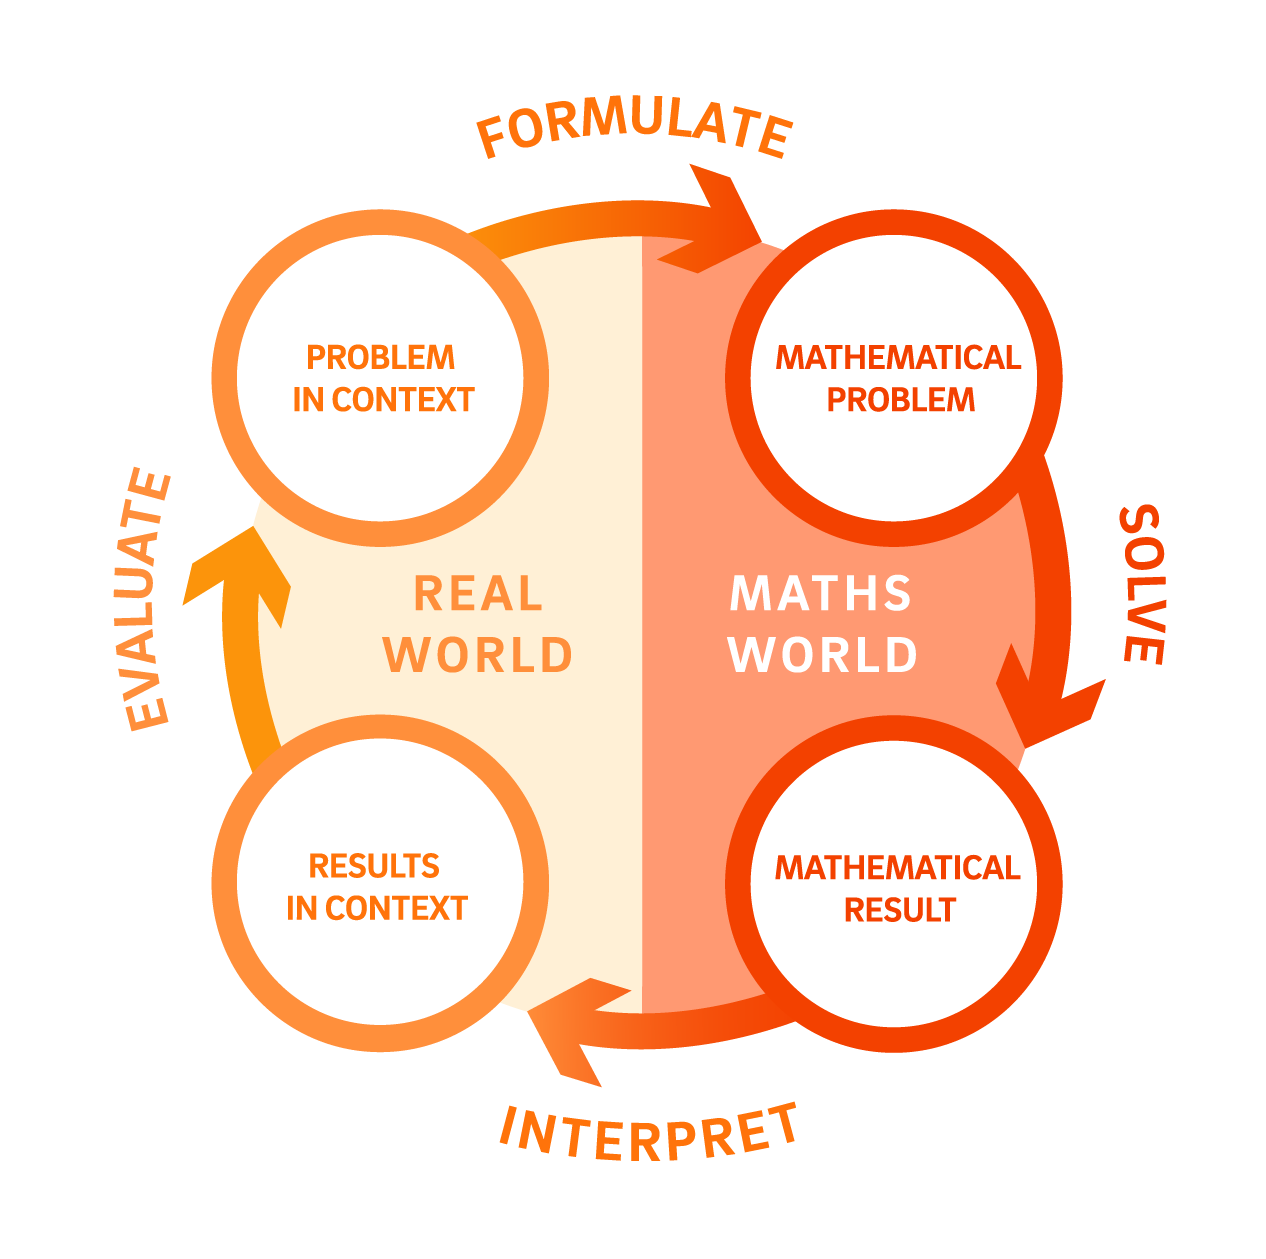
The process of mathematical modelling in this sequence
Formulate
Students are introduced to the problem of predicting bushfire spread and deciding when to evacuate. By sorting fire simulation cards and observing how weather conditions affect fire behaviour, they identify the key variables at play and consider how mathematics might help them model the spread of a fire.
Solve
Students use real bushfire data to investigate the relationship between wind speed and rate of fire spread, fitting a trend line and developing a rule of thumb. They then apply a more complex mathematical formula, and repeat this process for topography, developing a second rule of thumb for the effect of slope. They use spreadsheets to calculate predicted rates of spread using both the rules of thumb and the formal equations.
Interpret
Students compare predicted rates of spread against observed data, evaluating how well each method performs. They apply their models to two specific town scenarios, calculating how quickly a fire would reach each town under given conditions.
Evaluate
Students determine when each town should evacuate, weighing their mathematical calculations against practical factors such as evacuation time and the unpredictability of fire behaviour. They present and justify their recommendations to the class and reflect on when a rule of thumb is adequate and when the formal equation is needed.ctors, such as the unpredictable nature of fire behaviour and the time required for a safe evacuation.
References
Cruz, M.G., Alexander, M.E. The 10% wind speed rule of thumb for estimating a wildfire’s forward rate of spread in forests and shrublands. Annals of Forest Science 76, 44 (2019). https://doi.org/10.1007/s13595-019-0829-8
McArthur, A.G. 1968. Fire Behaviour in Eucalypt Forests. Leaflet No. 107. Ninth Commonwealth Forestry Conference, India, 1968.

'Mathematical modelling: Playing with fire' is one of our new teaching sequences for V9
- On the 'In this sequence' tab you'll find all the lessons in this sequence, a suggested implementation plan and curriculum alignment.
- The 'Behind this sequence' tab shows how key mathematical ideas develop over the sequence.
- Have you taught this sequence? Use the Feedback button to let us know how it went!