Statistics: Time to play
View Sequence overviewWe can use historical data from reliable secondary sources to inform our decisions about the future.
Whole class
Time to play PowerPoint
Each group
Computer access
Lesson
Revise: We are now answering the question: What is the best time of day to play outside for each month of the year?
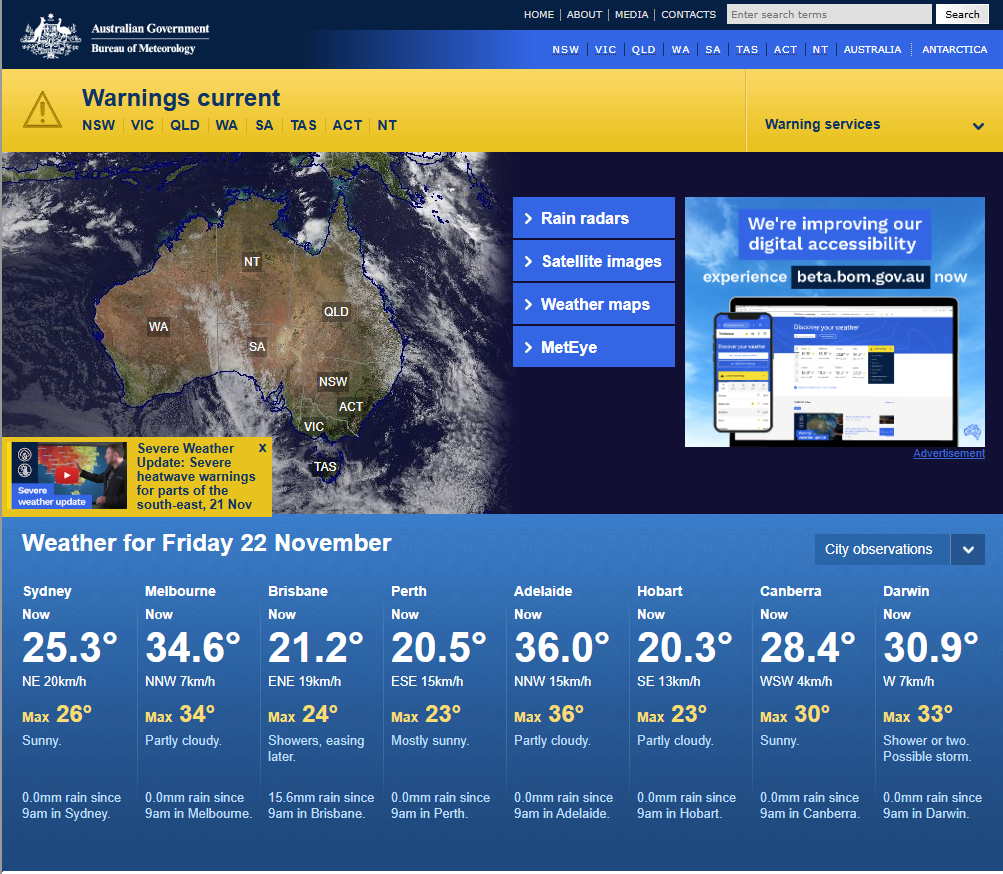
Explain to students that they will start by looking back at the historical data for the past four days to see what general comments they can make about the temperature across a day, particularly when is the warmest and coolest times during the day. Access the weather data for the past four days for your location.
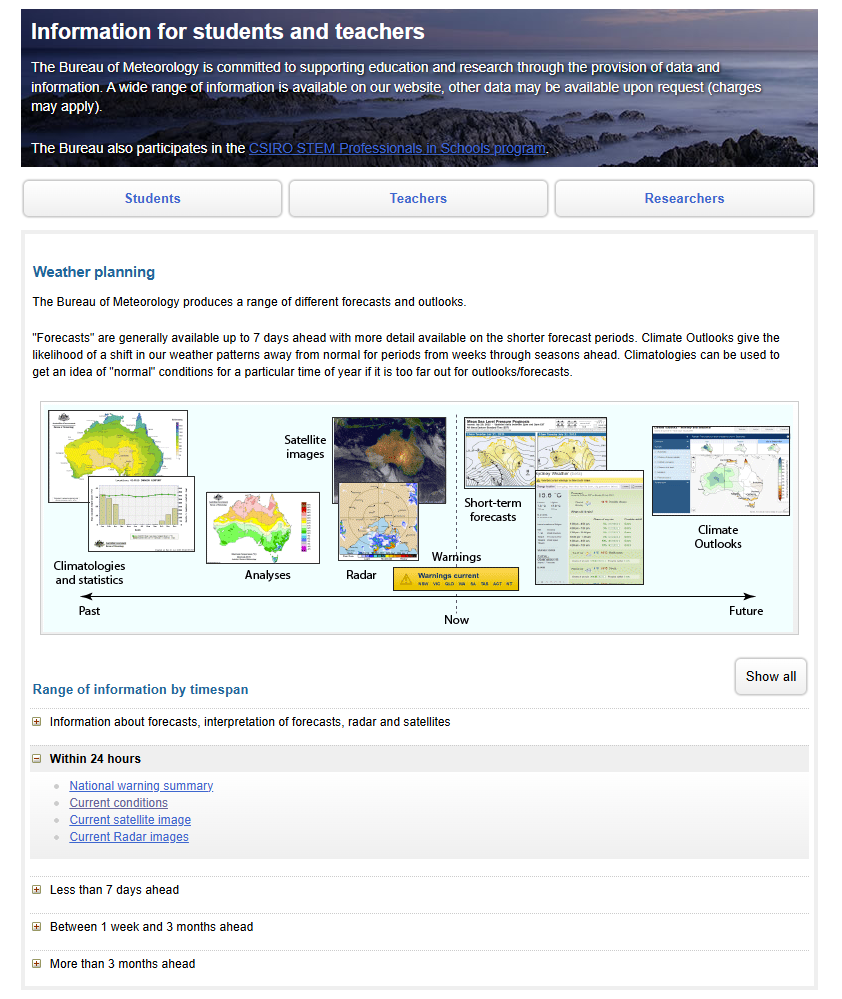
The Bureau holds a vast archive of weather observations, analyses and statistics.
A section of the Bureau of Meteorology website is designed for teachers and students - https://reg.bom.gov.au/climate/data-services/education.shtml

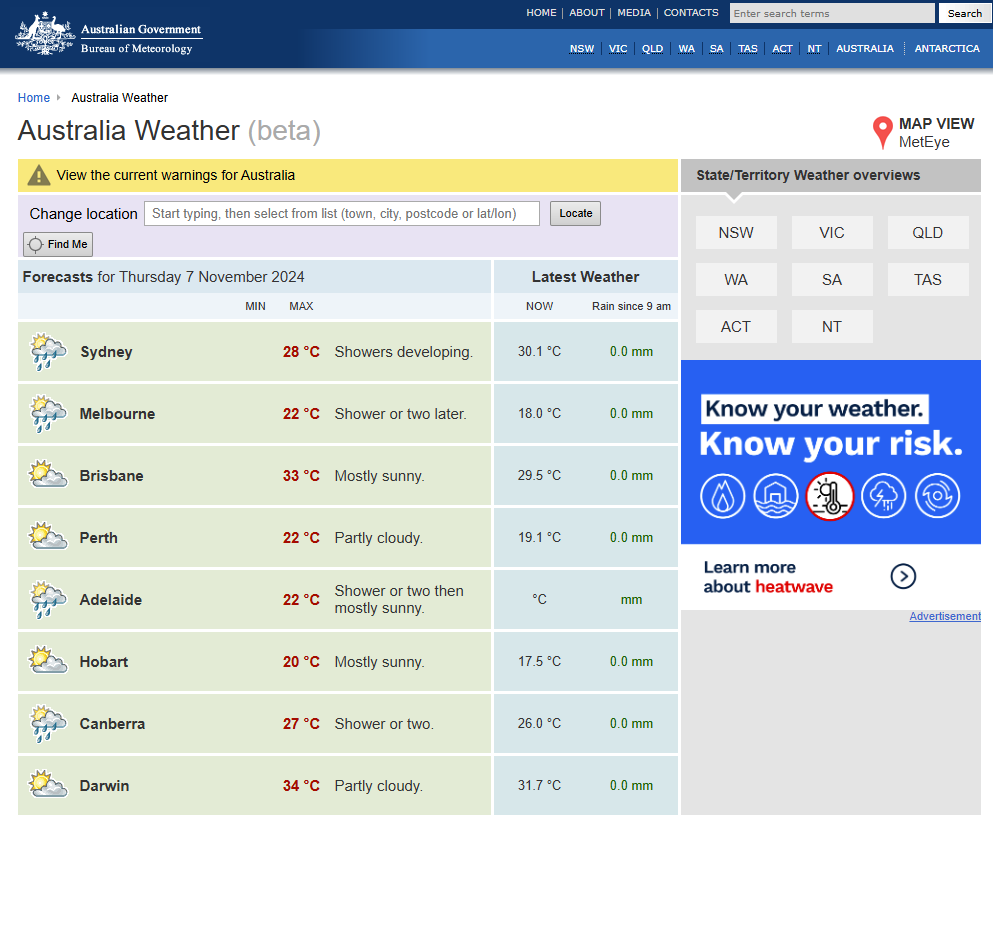
On this page you will find a section called “Weather planning”. Under the sub-heading “Within 24”, select “Current conditions”. Here you can search for the closest weather station to your school and access nearly 20 years of climate data.
This takes you to a new page - https://reg.bom.gov.au/places/

From this page you can search for the weather data for your specific location.
Conduct a class discussion.
Discuss:
- What general comments can you make about the temperature across the day for our location?
- It is important that students see that the hottest part of the day is usually mid-afternoon to late afternoon or early evening. Students may have other general comments to share.
- How can we use this information to help answer the question, “When is the best time to play outside for any given month of the year?”
- The answer to this question will be dependent on location. For many places the best time to play outside in the colder months will be in warmest part of the day, but this time should be avoided in the hotter months.
Explain to students that to help make decisions about the different months of the year, they can look at weather data from the Bureau of Meteorology website. This data provides maximum and minimum daily temperatures and average monthly and yearly temperatures. It is not possible to access the hourly data for past years.
The Bureau of Meteorology has ready access to historical data on the following elements for all locations across Australia:
- Temperature:
- Daily temperatures - maximum and minimum daily temperatures
- Monthly temperatures – average maximum and minimum; highest and lowest temperature; highest lowest temperature in a month average and the highest lowest temperature in a month
- Average maximum temperatures over many years
- Rainfall: Average daily or monthly rainfall temperatures going back many years
- UV Index: average annual, monthly and seasonal values of the UV Index
Historical data on UV Index can also be accessed for a limited number of major Australian cities from Australian Radiation Protection and Nuclear Safety Agency (ARPANSA)
You cannot access long range historical data on humidity and wind speed/gusts. You can request access to further data from the Bureau of Meteorology website (fees and charges may apply).
In this part of the sequence, we just use the temperature data to determine the best time to play outside.
The Bureau of Meteorology provides average daily, monthly and yearly temperatures. Different methods are used to calculate these averages.
Average annual temperatures: Average annual temperatures (maximum, minimum or mean) are calculated by adding daily temperature values each year, dividing by the number of days in that year to get an average for that particular year. The average values for each year in a specified period (1991 to 2020) are added together and the final value is calculated by dividing by the number of years in the period (30 years in this case).
Average monthly temperatures: Average monthly and seasonal temperatures are calculated by adding monthly and seasonal temperature averages (from daily data) and dividing by the number of years in the specified period.
Average daily temperatures: Mean temperatures are calculated by adding the daily maximum temperature and the daily minimum temperature and dividing by two.”
Discuss: What does average temperature mean?
- Students may be familiar with the term “average temperature” even though the concept of average is not introduced in the curriculum until the secondary years. The average temperature can be thought of as the central or typical temperature.
Explain: We are now answering the question––“What is the best time of day to play outside for each month of the year?”. We will use what we have learnt so far about our location and historical weather data from previous years from the Bureau of Meteorology to make predictions on the best time to play outside for each month of the year.
Show students slide 14 of Time to play PowerPoint. Explain that the class needs a plan for data collection. This slide presents the discussion questions listed below. Discuss and answer each question with the students. The first question has already been answered as part of this discussion. Record the decisions made by the class onto the slide for reference.
Discuss:
- What information do we need to collect to answer the question?
- Students will access monthly average maximum and minimum temperatures
- What time period should the data cover?
- Allow students to offer their suggestions. For each of their suggestions, ask students to consider how that data will help make more informed predictions about the best time to play outside.
- Establish with the students that they will need multiple years of monthly maximum and minimum temperatures. The Bureau provides easy access to average temperatures calculated over around 35 years.
- How will we record our data?
- The data that the students will access from the Bureau’s website is represented using tables and graphs. For this part of the investigation the students will just use the graphs. These graphs are available to be used under a Creative Commons licence which means that students can copy them for their own use.
Is this data reliable?

We live in a data-saturated world. The internet means that we have ready access to a plethora of secondary data. Not all of this data is reliable. It's not uncommon for data to be presented in a misleading manner to support a specific narrative that may not reflect the entire truth.
With so much data, we must ensure the data we choose to use is reliable. This idea is reflected in the Statistics content descriptors for Year 5 in the Australian Curriculum: Mathematics. Content descriptor AC9M5ST01 states that students need to “acquire, validate and represent data…”. Do you see it there? Students should not just acquire and represent data; they must also validate it.
How can you determine if secondary data is reliable and valid? The best approach is to use data from reputable sources. In this context, students are gathering climate data, and with various narratives emerging around climate issues, it’s essential to rely on information from trusted sources.
The Bureau of Meteorology records data from weather stations right across the country. The Bureau requires accurate data to make future predictions about the weather. We might joke that we cannot trust the Bureau because their weather predictions are not 100% accurate, but these inaccuracies indicate that predicting the weather is very complex. It does not indicate this historical data available is unreliable.
Ask students to return to their small groups. Allocate each group a category of data to collect—either daily or monthly maximum and minimum temperatures.
Show students slide 15 of Time to play PowerPoint. This slide provides a short video tutorial on how to access historical weather data for a given location from the Bureau of Meteorology’s website. The Bureau represents this data as tables and graphs. Remind students that they will be collecting the graphs.
The Bureau holds a vast archive of weather observations, analyses and statistics.
This short video shows how to access historical weather data from weather stations across the country.
A section of the Bureau of Meteorology website is designed for teachers and students - https://reg.bom.gov.au/climate/data-services/education.shtml
On this page you will find a section called Past weather, measuring instruments, data and statistics. In this section and under the sub-heading Types of Data, select Historical Weather Station Data and then Climate Data Online. https://reg.bom.gov.au/climate/cdo/about/map-search-guide.shtml
Here you can search for the closest weather station to your school and access nearly 20 years of climate data.
The Bureau of Meteorology also provide a tutorial showing how to use the climate data online map tool - https://reg.bom.gov.au/climate/cdo/about/map-search-guide.shtml
Provide the students time to explore the Bureau’s website and to access the graphs that they need. Remind students of the class data plan which is outlined on slide 14 as needed.
Ask the students to make a display of the graphs that they have collected.