Statistics: Time to play
View Sequence overviewAnalysing the shape of the data helps us see the story that the data is telling.
Whole class
Time to Play PowerPoint
Each group
Computer access
Each student
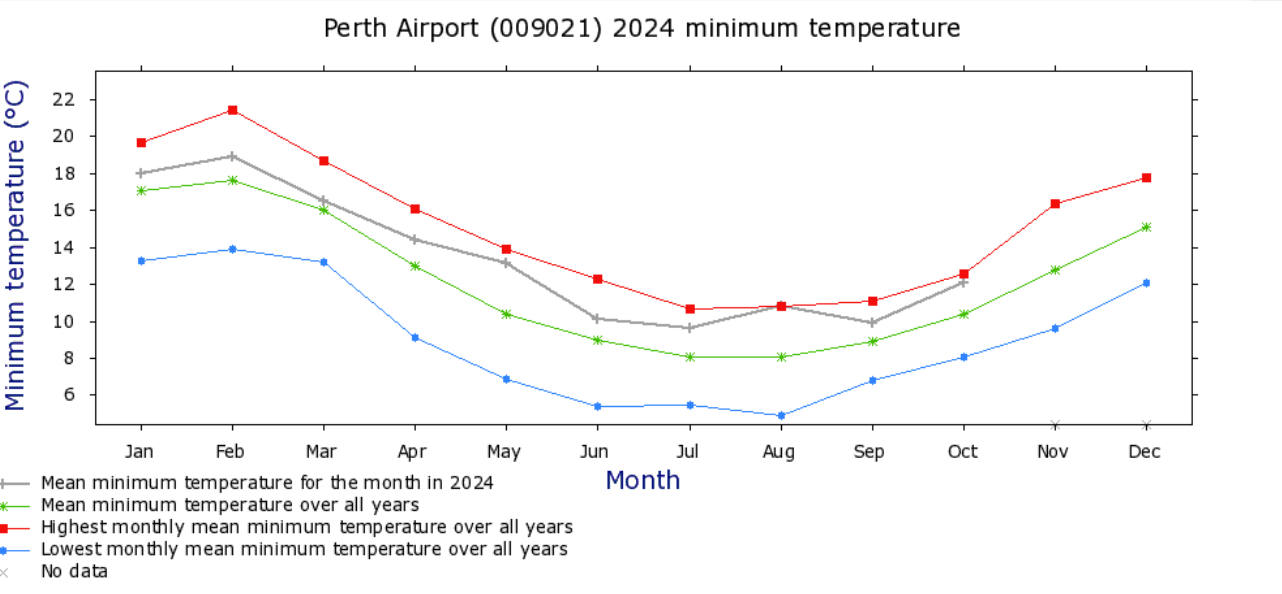
The best time across Australia Student sheet with the temperature graph for your local area inserted in the space provided
Lesson
Revise: The question investigated was: What is the best time of day to play outside for each month of the year?. We have used historical data to predict the best times to play outside for our local area.
Revise the different times for the different months of the year.
Ask: Would our predicted times for the different months of the year be the same for all places in Australia?
Allow students to share some of their initial thinking on the question. Ask them what evidence they have for their comments. Their evidence may be based on personal experience or knowledge of different geographic locations in Australia.
Establish the need for data to provide evidence for whether the best time to play outside would be the same or different for other parts of Australia.
Provide students with The best time across Australia Student sheet. This sheet provides five different graphs for locations around Australia. In the space provided, add the temperature graph for your local area to this sheet, so students can make comparisons.
Provide students time to compare the graphs and make predictions about whether the best time to play outside would be the same or different to the students’ local area.
Exploring distribution
When we analyse data, our goal is to understand its variability. The distribution of data is key to describing and accounting for variability.
In this activity, students examine how temperature varies across a year for towns and cities in diverse geographical locations across Australia. The range of temperatures indicate the range of variability in temperature for each location.
We can see similarities in the distribution of data for the different towns and cities. The general ‘U’ shape of the data, and the symmetry that is evident, point to the different seasons of the year. We can also see differences. The depth of the curve for each location is different, because the range of variability is not common. We can account for this difference in distribution using the geographical location of each town or city, for example, inland or coastal, mountains or desert.
Gather students together for a class discussion.
Discuss:
- How is the shape of the data similar across the graphs? What do these similarities tell us?
- Each graph is curved with the lowest point of the curve in the middle (around July). The shape reflects the Australian seasons, and for each of these Australian locations we can say that they experience warmer weather during the summer months and cooler weather during the winter months.
- How is the shape of the data different across the graphs? What do these differences tell us?
- The curve is different in each graph. The curve is more pronounced in some graphs (e.g. Canberra) compared to other graphs (e.g. Cairns). This shows that the temperature range in Canberra is typically greater than in Cairns. It is important to note that the scales for the y-axis are different across the graphs.
- Students may make some observations such as the temperature range tends to be smaller for coastal areas compared to inland areas.
- How does the shape of the different graphs inform our predictions for the best time each month to play outside in the different locations?
- There will be some similarities in the best time to play, for example the best time is likely earlier in the day in summer compared to winter. As the range of temperatures is greater, the best time may be slightly different for each location.
- What might the shape of the graph look like for a location in the Northern Hemisphere? What does the shape of the curve tell us about the best time to play outside in these locations?
- The curve will be opposite—the highest point of the curve will be in the middle as summer is in the middle of the year for countries in the Northern Hemisphere.
- This means that the best time to play outside are likely to be different compared to Australia.
Allow the students time to play outside at the time they have predicted to be “best” for the local area and for that time of year. If the “best” time has already passed, provide time the following day to play.
Discuss:
- We predicted that this would be the "best" time to play. Does that mean that on any day this month, it would be the best time?
- There can be considerable variation across a month, for example, just because 11 a.m. is predicted to be the best time of the day to play in March, doesn't mean 11 a.m. every day on March is always going to be sunny and rain-free.
- We played outside at [time]. How does this compare to the normal time we go outside to play?
- The routine of a school day doesn't account for the "best" time to play outside. While it might not be possible to change break times, there might be other factors that the class could consider, such as when we do sport or PE, or why students must wear hats when playing outside.