Mathematical modelling: Playing with fire
View Sequence overviewVisually representing data helps us observe variation.
Varying one factor while keeping others constant allows us to observe the specific impact of that factor.
Whole class
Playing with fire PowerPoint
Optional video: Spark: A better way to predict the spread of bushfires (2:10)
Each group
Playing with fire Bushfire cards
Lesson
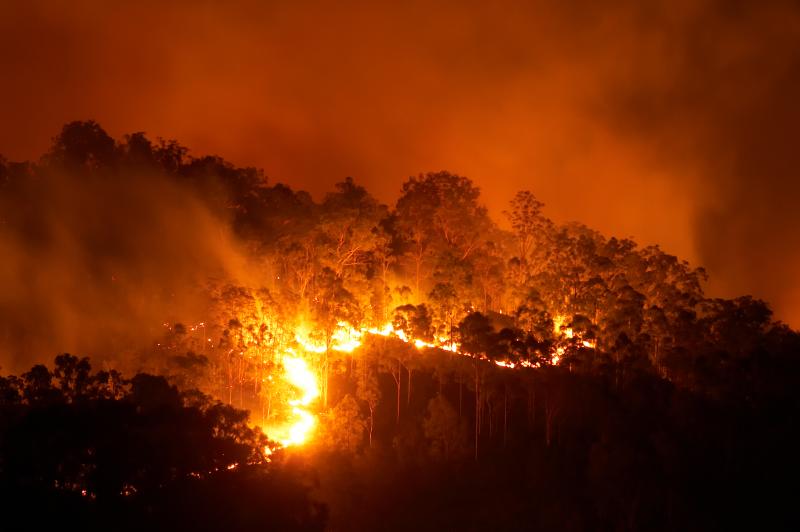
Use slides 4 and 5 of the Playing with fire PowerPoint to introduce the context of bushfires. Explain that Australia is one of the most bushfire-prone countries due to its hot, dry climate and flammable vegetation like eucalyptus. Note that bushfires have become more frequent and severe in recent years.
Explain that emergency services use models, including mathematical models, to predict how fires will spread, identify areas at risk, and decide when to evacuate. Emphasise that these models rely on understanding key factors that influence fire behaviour.
(Slide 6) Explain that in this investigation, students will act as emergency service experts. They will create and use mathematical models to predict the rate of fire spread and use this to decide when a town should evacuate. To do this, they will need to understand the key factors that influence fire behaviour.
Ask: What factors do you think influence how a fire behaves?
Invite students to discuss in small groups, then share ideas with the class. Record responses on the board to create a class list and identify any common themes.
Show slide 7 of the Playing with fire PowerPoint, which introduces the fire behaviour triangle: weather, topography, and fuel. Prompt students to link their themes to this model.
Note: The fire behaviour triangle differs from the fire triangle (heat, fuel, and oxygen), which relates to combustion.
Explain to students that they will explore how weather and topography influence fire behaviour, beginning with weather. Over the course of this exploration, the fuel type, dry eucalypt forest, will stay constant.
Establish that temperature, humidity, and wind are the key weather factors on fire. Discuss how each might affect fire behaviour, especially the rate of spread. Don’t confirm answers at this point.
The influence of weather factors
In the first three lessons of this sequence, students use mathematics to model how weather conditions influence the spread rate of bushfires. This foundational understanding sets the stage for exploring models of weather factors.
Temperature
High temperatures influence bushfire behaviour by increasing the likelihood of ignition and accelerating the spread of fire. When the air temperature is high, it preheats fuels such as grass, leaves, bark, and branches, bringing them closer to their ignition point. As temperatures rise, moisture in vegetation evaporates, leaving fuels dry, brittle, and highly flammable.
The impact is even greater during extended periods of hot weather, such as during heatwaves or prolonged droughts. Over time, these hot, dry conditions dry out both surface fuels and deeper layers of vegetation, reducing fuel moisture. This cumulative drying increases the drought factor, making the landscape extremely fire prone. Even a small spark in these conditions can lead to a fast-moving and intense fire.
Prolonged hot conditions also lead to more intense and unpredictable fire behaviour. Fires can spread more rapidly, burn with greater heat, and generate stronger convection currents, which may lift embers high into the air and cause spot fires kilometres away.
Humidity
Humidity refers to the amount of moisture in the air and plays a key role in how easily vegetation ignites and burns. When humidity is low, moisture is drawn out of grasses, leaves, and other fuels, making them drier and more flammable. Extended periods of low humidity can have a cumulative effect, drying out the landscape over time. This leads to an increase in the drought factor, a measure used by fire services to assess how dry and fire-prone the environment is. The drought factor takes into account recent rainfall and soil moisture, with a high rating indicating that vegetation is critically dry, ignites easily, and burns intensely. Even if humidity rises briefly, a high drought factor means fuels remain highly flammable, significantly increasing the risk of fast-moving and uncontrollable fires.
Extended periods of low humidity were a major contributing factor to the devastating 2019–2020 Black Summer bushfires in Australia. Large parts of the country experienced prolonged drought and record-low humidity in the months and years leading up to the fires, creating ideal conditions for extreme and unpredictable fire behaviour.
Wind
Wind has a powerful and often unpredictable influence on bushfire behaviour. It supplies oxygen to fuel the fire, increasing its intensity and allowing it to burn more vigorously. Wind also tilts flames toward unburnt vegetation, preheating and igniting fuels more rapidly. This causes the fire front to advance more quickly, increasing the rate of spread—the speed at which fire moves across the landscape. In strong winds, fires can travel at alarming speeds, reducing the time available for warning and evacuation.
Wind also plays a key role in producing spot fires. It can lift and carry burning embers well ahead of the main fire front, sometimes several kilometres, starting new fires in areas thought to be safe. These spot fires can join with the main fire or ignite separate outbreaks, making fires more complex and harder to contain.
Strong, gusty, or shifting winds can cause sudden changes in fire direction and intensity, leading to erratic and dangerous fire behaviour that poses serious risks to people, property, and emergency responders.
Introduce Spark, a fire behaviour simulation tool developed by the CSIRO. Explain that Spark uses topographical and weather data, along with mathematical models, to simulate how a bushfire spreads over time. You may show the video Spark: A better way to predict the spread of bushfires (2:10) to introduce Spark and show how it is used in the field.
Show slide 8 of the Playing with Fire PowerPoint, which shows the output of two fires simulated using Spark. Point out the coloured rings, called isochrones, which show the fire’s perimeter at one-hour intervals and help visualise the fire’s speed and direction.
Discuss what students notice about the two fire simulations, such as differences in weather conditions and fire size.
(Slide 9) Highlight the weather factors involved. Discuss students’ predictions in response to:
- How might each factor influence fire behaviour?
- Which factor might have the greatest impact on the rate of spread?
Divide students into groups of 2-3. Provide each group with a full set of the nine Bushfire cards.
Pose the challenge: Organise your cards to show how different weather factors affect bushfire behaviour. How might you organise them using one category? How might you organise them using multiple categories?
Ask students, in their groups, to explore different ways of sorting the cards. Encourage them to consider how their chosen method of sorting highlights the influence of different weather factors on fire behaviour.
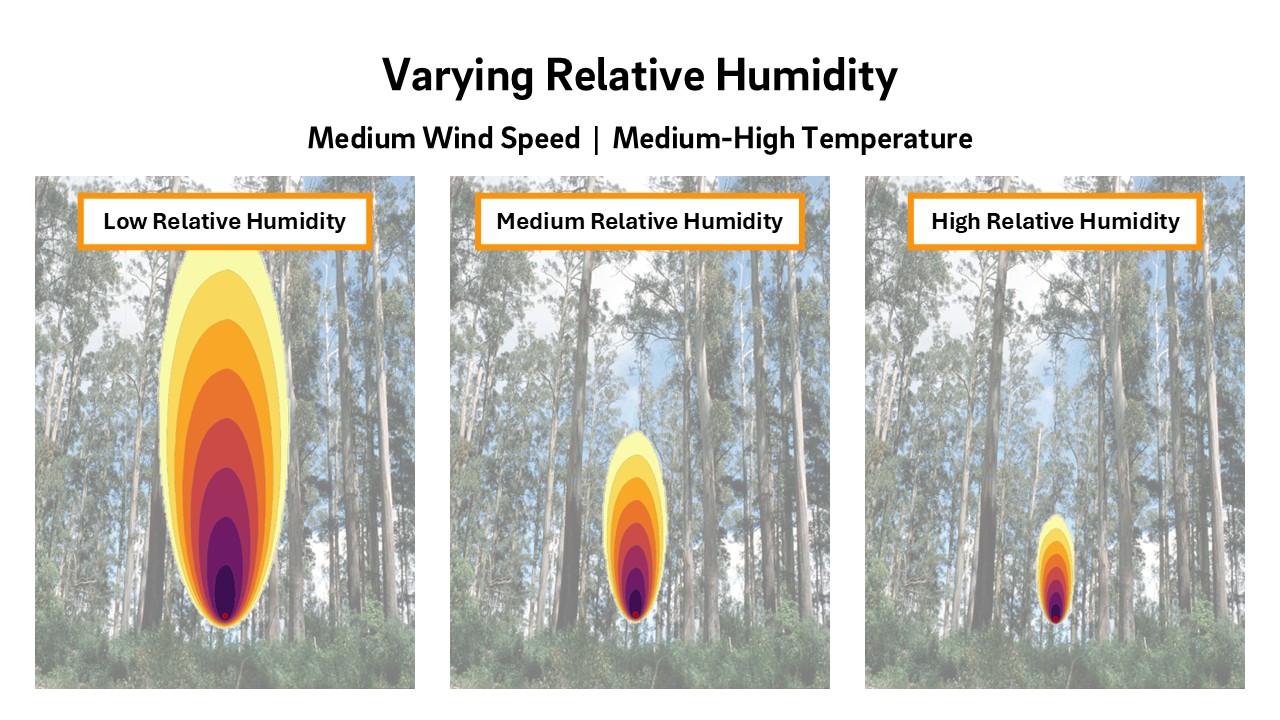
- What does a change in humidity affect?
- Humidity influences the size of a fire.
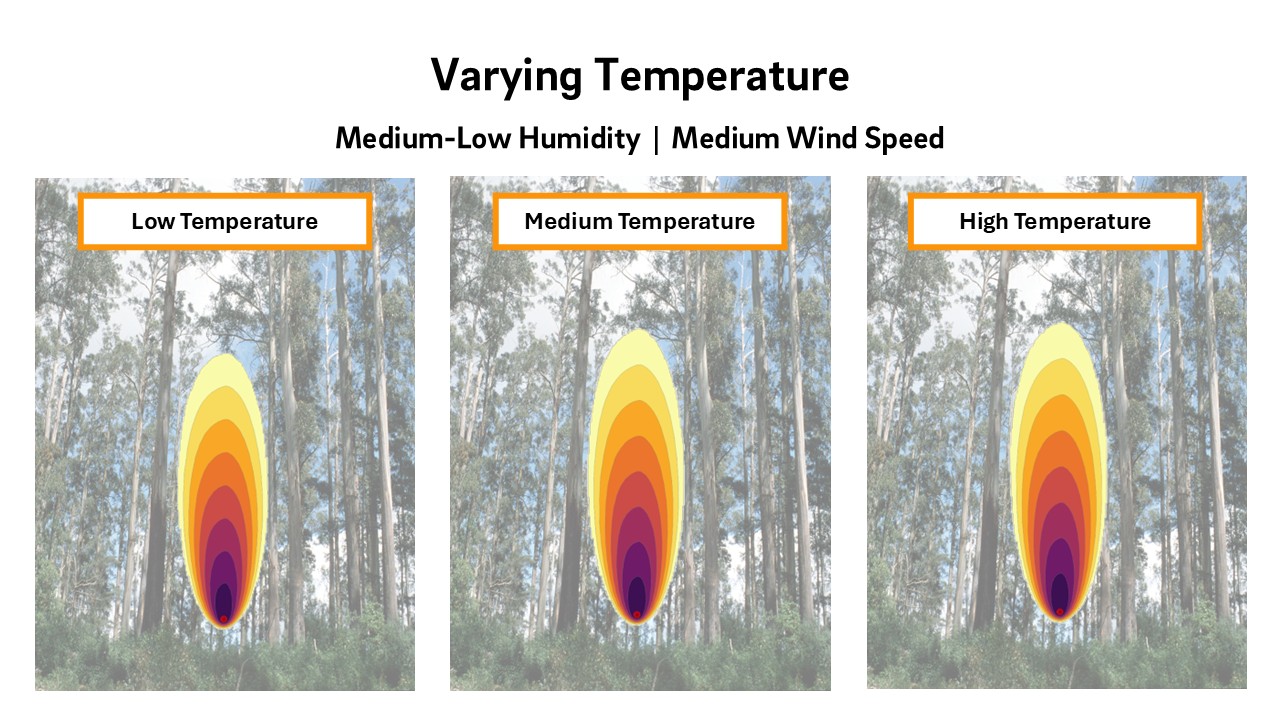
- What does a change in temperature affect?
- Compared to wind and humidity, temperature has relatively low influence on fire behaviour.
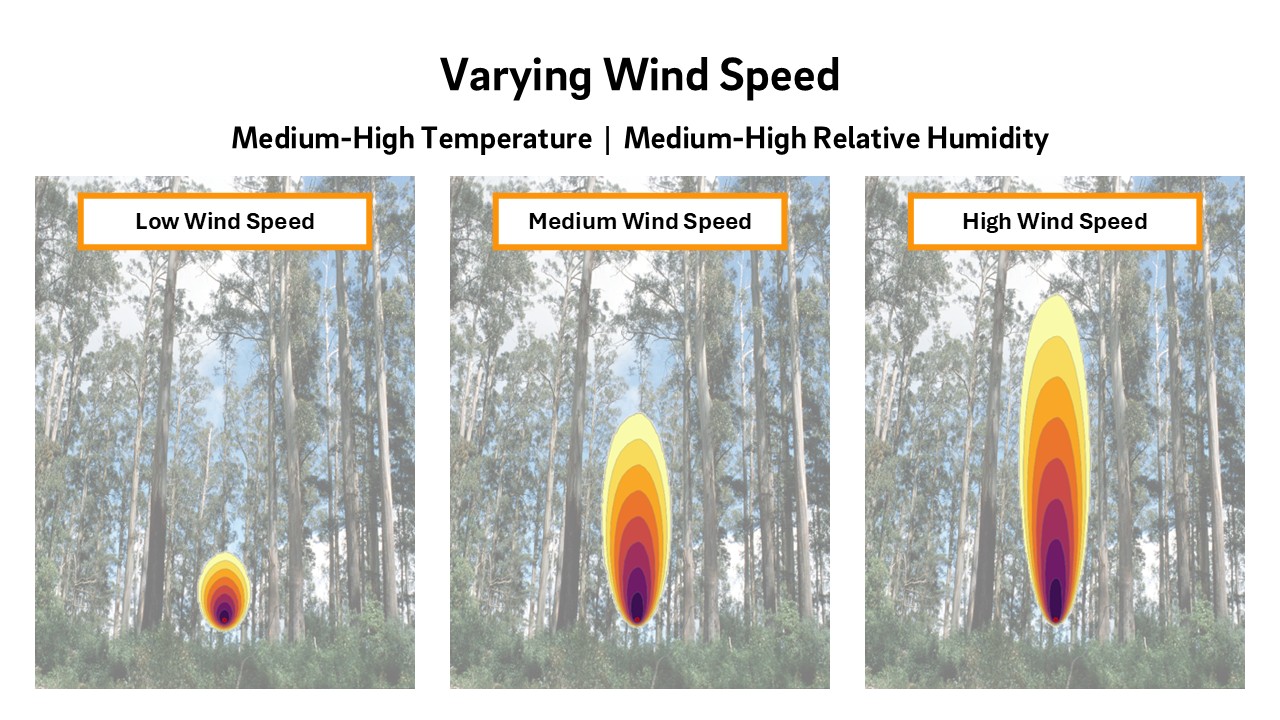
- What does a change in wind speed affect?
- Wind influences the shape and rate of spread of a fire.
- How do these factors interact?
- Humidity, air temperature and windspeed interact in different ways to influence bushfire behaviour.
Sorting the cards by a single weather factor
A set of three cards has been created for each weather factor, showing low, medium, and high conditions while the other two remain constant. This allows students to visually observe how changes in a single factor influence fire behaviour.
Sorting the cards by all three weather factors
The cards can also be sorted as a 3x3 grid, aligning the low, medium, and high conditions for each weather factor.
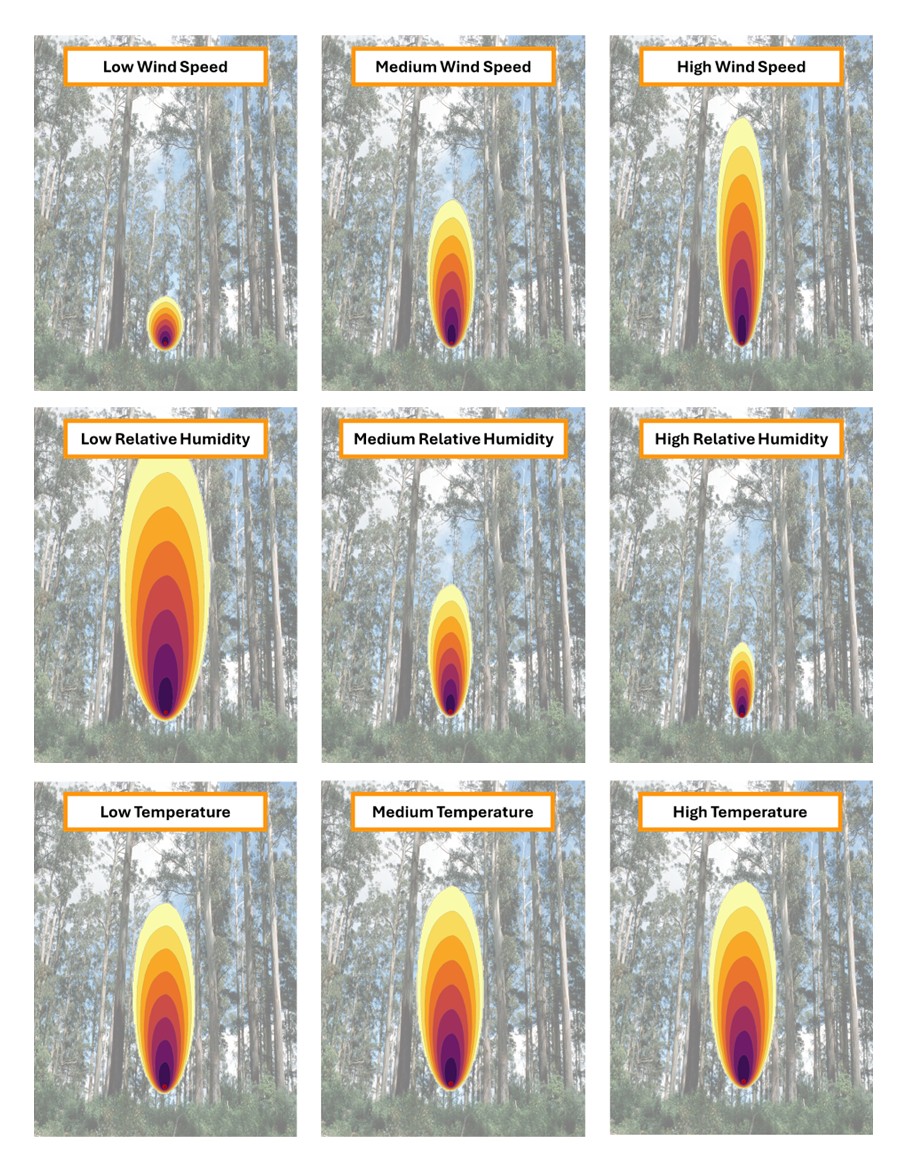
The card sort shows that humidity and wind significantly influence fire behaviour. In the humidity sequence, lower humidity results in the fire becoming both wider and longer. In the wind sequence, higher wind speeds cause the fire to extend further in length rather than width.
Are simulations graphs?
A graph is a visual way of representing information or data. It helps us identify patterns, trends, and relationships between two or more variables.
The fire simulations generated by Spark are considered graphs because they use data to visually represent how fire spreads over time under different conditions. In this case, the variables are the weather factors: wind, humidity, and temperature. By keeping two of these factors constant and changing the third, we can observe how that specific weather condition influences fire behaviour. This non-standard visual representation helps us better understand the relationship between weather conditions and the rate of fire spread.
Ask some students to share the way they sorted their cards, and the observations they were able to make based on their sorting.
Conduct a whole class discussion. Slides 10-13 may be used to support the discussion.
Discuss:
- How does humidity influence how a fire behaves? Why might this be?
- Humidity has a big impact on the size of a bushfire.
- Discuss that low humidity dries out vegetation, making fuels more flammable, while high humidity can slow fire behaviour by keeping fuels moist.
- How does temperature influence how a fire behaves? Why might this be?
- Temperature has less impact on the size and spread of a fire than humidity and wind.
- Heat dries out vegetation, making it easier to ignite and causing fires to spread more quickly.
- What impact might prolonged periods of low humidity and high temperature have on fire behaviour?
- Extended periods of low humidity and high temperature dry out vegetation, making it more flammable. This increases the drought factor and leads to faster-spreading, more intense, and harder-to-control fires.
- How does wind influence how a fire behaves? Why might this be?
- Wind makes fires spread faster and more unpredictably.
- Wind supplies oxygen to the fire, pushes flames into new fuel, and can carry embers ahead of the fire, starting spot fires.
- What combination of factors to you think might lead to the most extreme and dangerous fire conditions? Why?
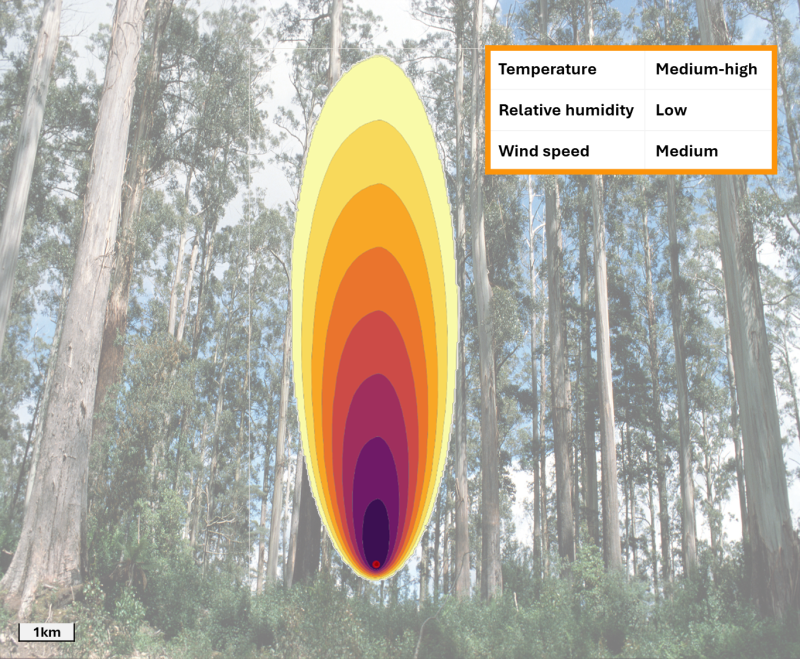
- The most catastrophic fire conditions happen when high temperatures, low humidity, and strong winds occur together. These conditions make vegetation extremely dry, help fires ignite easily, and cause them to spread rapidly and unpredictably.
- Slide 13 presents a simulation using high temperatures, low humidity, and strong winds.
Conclude by asking: Which weather factor has the greatest impact on how quickly a fire spreads and when a town might need to evacuate? Why might this be?
- Humidity and wind both strongly influence fire behaviour: lower humidity makes fires spread wider and longer, while higher wind speeds extend the fire’s length.
- Wind is unpredictable and can change quickly, pushing flames toward unburnt fuel, drying it out, and carrying embers ahead to start spot fires. This means that stronger winds make fires spread faster and less predictably.
Using variation
Variation theory is a design principle used in mathematics education. By varying certain aspects of a task while keeping others constant, students’ attention is drawn to critical features of mathematical ideas. This approach helps learners notice patterns, identify key relationships, and discern what changes and what remains the same. In doing so, it supports deeper understanding and strengthens their ability to generalise across different contexts.
In the fire simulations used in this task, one weather factor is varied while the other two remain constant. This draws students’ attention to the influence of that particular factor, helping them notice and make generalisations about its influence on fire behaviour.