Mathematical modelling: Playing with fire
View Sequence overviewIn bivariate data, a trend line helps show the relationship between two variables and is useful for making predictions.
A rule of thumb is a practical estimate based on observed data rather than precise calculation.
Whole class
Playing with fire PowerPoint
Playing with fire Spreadsheet (Teacher)
Each group
Playing with fire Spreadsheet (Student)
Access to computers, at least 1 between 3 students
Lesson
Refer to slide 16 of Playing with fire PowerPoint and discuss the generalised statements constructed in the previous lesson. Show slide 17 to review that wind speed significantly influences the rate at which a fire spreads.
Pose the question: Is there a mathematical relationship between wind speed and the rate of spread of a fire?
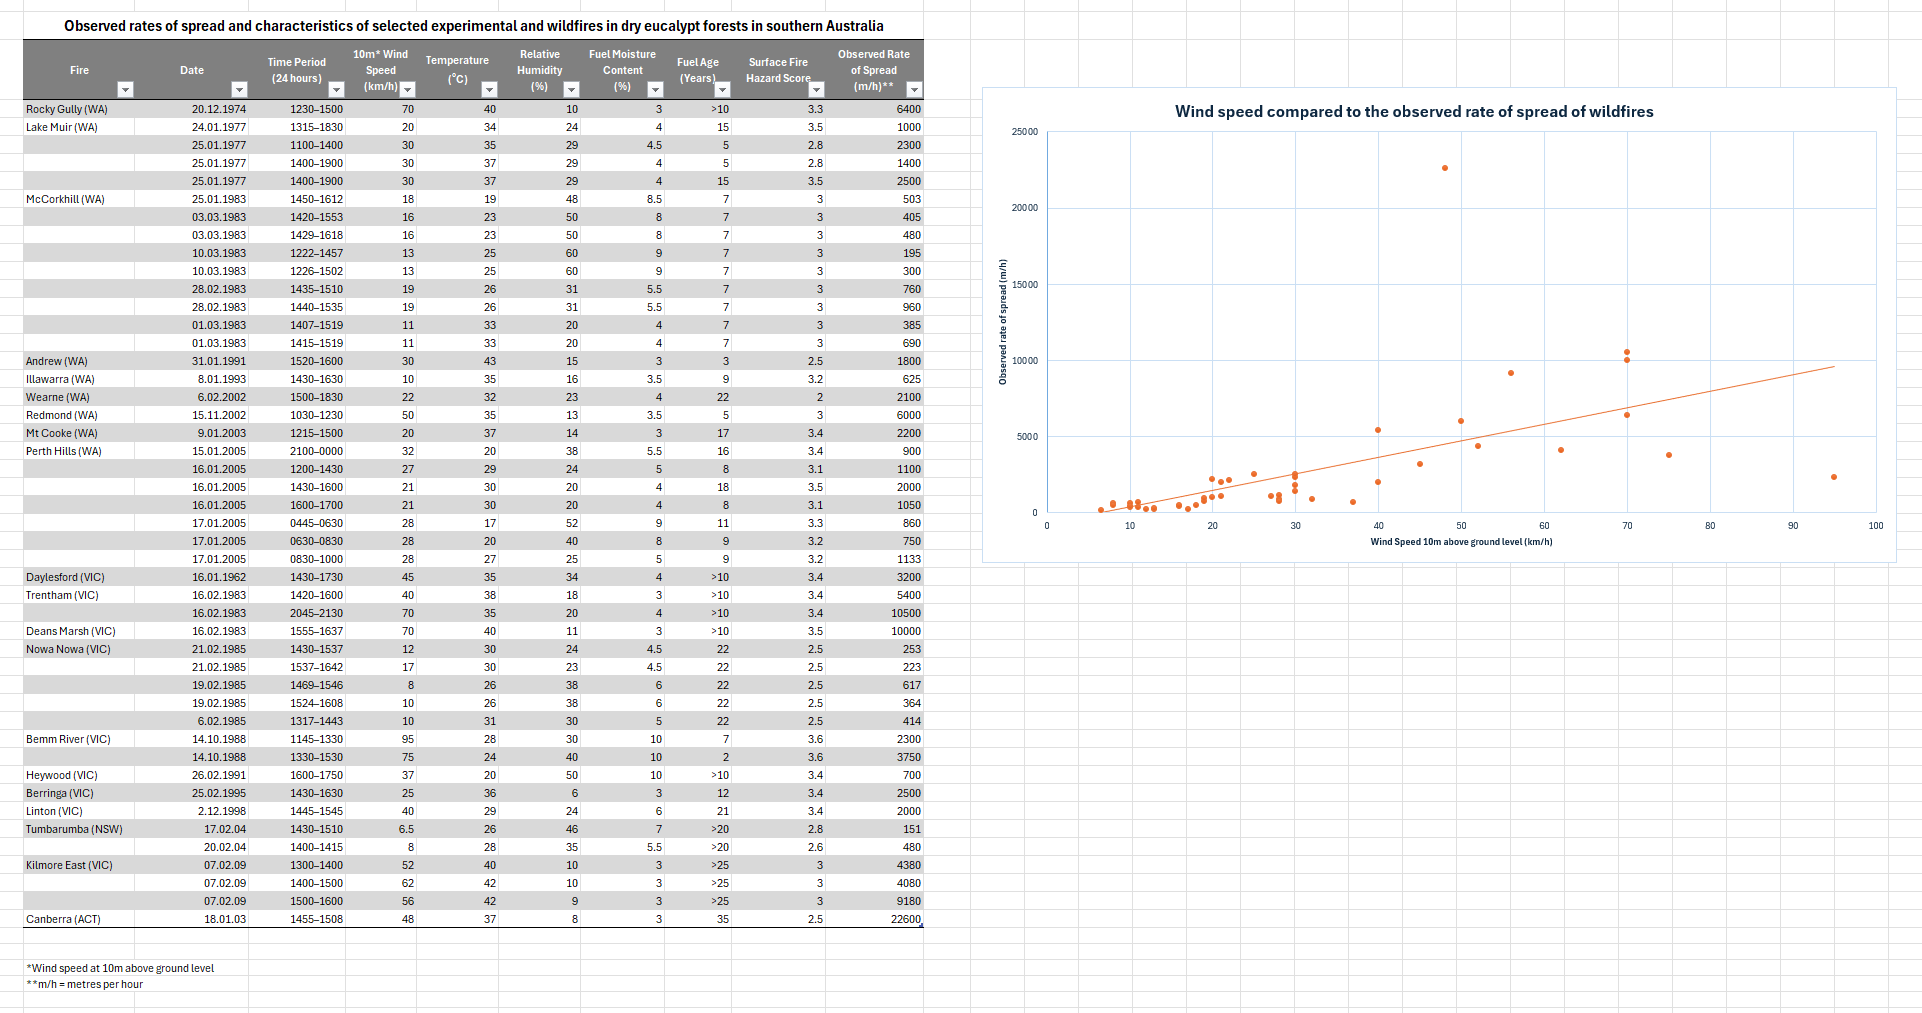
Divide students into pairs and provide each pair with access to a computer and the Playing with fire Spreadsheet (Student). Ask students to open the first sheet, Fire data. Explain that this sheet contains data collected by researchers on the observed rates of spread and other characteristics of selected bushfires in dry eucalypt forests in southern Australia from 1974-2003.
Briefly discuss the data that is provide, noting in particular the different units that are used.
The spreadsheet data used in this activity is sourced from a research article by Cheney, Gould, McCaw, and Anderson (2012). Each fire is named according to the location of the fire. The date and time of the fire are also listed. The other variables in the table are listed and explained below:
- 10m wind speed (km/h): Weather stations typically measure the wind speed at a height of 10 metres above ground level, measured in kilometres per hour.
- Temperature (degrees Celsius): This is the average temperature for the time period listed.
- Relative humidity (%): The the amount of moisture in the air expressed as a percentage.
- Fuel moisture content (%): The measure of the amount of water present in fuel (e.g., vegetation) expressed as a percentage of the fuel's dry weight.
- Fuel age (years): The time that has elapsed since the last significant disturbance (e.g., fire, logging, or clearing) that removed or consumed the fuel sources (e.g., vegetation) in an area.
- Surface fire hazard score: A value given to indicate the potential for a fire to spread along the ground's surface, driven by weather conditions and fuel availability.
- Observed rate of spread (m/h): The actual rate of spread of the fire as observed in the field. This has been measured in metres per hour.
Explain to students that they will need to identify the relevant data from the table, then organise and represent this data to investigate whether there is a mathematical relationship between wind speed and the rate of fire spread.
Allow students time to conduct the investigation.
For this investigation, students only need the wind speed and rate of fire spread data. Wind speed is measured in kilometres per hour (km/h) and the rate of spread in metres per hour (m/h). Students may convert one measure to match the other before graphing; if not, their graphs will have the same shape but different axis units. This naturally leads to a discussion on the need to compare like units when expressing the relationship as a rule of thumb.
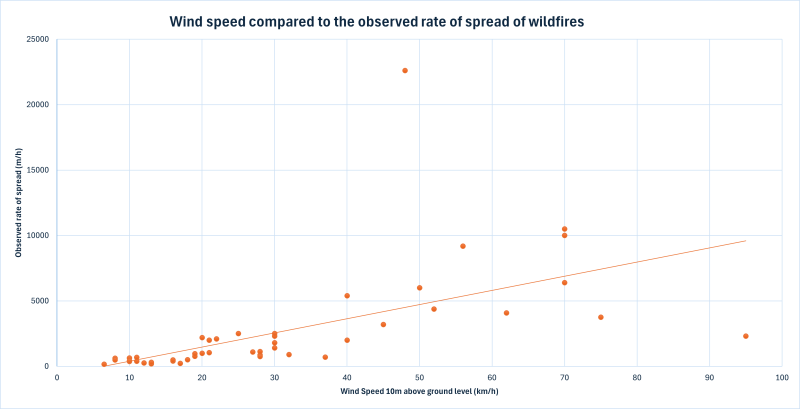
One way to represent the data is to convert the rate of fire spread to kilometres per hour and then graph it against the 10m wind speed for fires in dry eucalypt forests. A trend line suggests that the forward rate of spread of an established fire is approximately 10% of the average 10 m open wind speed for dry Eucalypt Forests. This rule of thumb is commonly used in the field to support decision-making in time-critical situations.
Further information on the rule of thumb is available from the CSIRO’s PyroPage:
Selecting and representing the right data
Too often, students are provided with neat, curated datasets and asked to represent the information, without the opportunity to engage in the critical thinking that comes from selecting and organising data themselves. To build their statistical reasoning, students need opportunities to make decisions about what data is relevant to their investigation, how it should be organised, and which representations should be used.
In this lesson, students are deliberately given more data than they need to answer the question. This encourages them to critically analyse the data, identify what is most useful, and justify their choices. In doing so, they develop key skills for conducting statistical investigations.
Estimating rate of spread

The relationship between wind speed and fire spread shows that fires in dry eucalypt forests typically advance at about 10% of the average 10 m open wind speed. This rule of thumb is widely used in the field to support decision-making during time-critical events.
While the 10% rule offers a useful estimate, fire behaviour is complex and often unpredictable. No two fires behave identically, as shown by the variability on the graph. Factors such as drought conditions and fuel age can greatly increase the rate of spread. The 2003 Canberra bushfire illustrates this vividly: despite wind speeds of 48 km/h, the fire advanced at an extraordinary 23 km/h—nearly 50% of the wind speed. A high drought factor and decades of fuel accumulation drove the fire far beyond predictions, resulting in catastrophic losses, including 510 homes destroyed, hundreds injured, and four lives lost.
Although more sophisticated mathematical models provide improved predictions, they too remain approximations, limited by the inherent unpredictability of fire behaviour.
Select several groups to share their data representations and describe the relationship they observe between wind speed and the forward rate of fire spread. If students have not used a trendline, show how this can be added to approximate the relationship between wind speed and the rate of spread.
The Fire data sheet in the Playing with fire Spreadsheet (Teacher) contains a completed data representation for reference, which is also shown on slide 18 of the Playing with fire PowerPoint. This example uses a linear trendline to approximate the relationship between wind speed and the rate of spread. These resources may be helpful in guiding the class discussion.
Discuss:
- If the wind speed was 60km/h, what is the approximate forward rate of spread of a fire? What if the wind speed was 25km/h? What about 100km/h?
- If the forward rate of spread of a fire was approximately 5km/h, what do you predict the wind speed to be? Why?
- Students can use the trendline to approximate the forward rate of spread of a fire.
- These questions help to highlight that the forward rate of spread of a fire is close to 10% of the wind speed. Don't point to this as yet; allow students to create this general statement for themselves.
To conclude, pose the questions:
- What general statement describes the mathematical relationship between wind speed and the forward rate of spread of a fire?
- Establish that the forward rate of spread of an established fire in dry eucalypt forests is approximately 10% of the average 10 m open wind speed.
- Explain to students that this approximation is referred to as a rule of thumb.
- How accurate is this rule of thumb?
- The forward rate of spread for most fires in this dataset is slightly lower than the estimate, which is useful because it is safer to err on the side of caution when making evacuation decisions.
- Discuss the outliers, particularly those fires that spread far more rapidly than the rule of thumb would predict.
Rules of thumb
A rule of thumb is a simplified guideline or approximation based on practical experience, observation, or empirical data. It provides a quick and easy way to estimate an outcome without the need for complex calculations.
It is important to note that a rule of thumb is not a mathematical model in the formal sense. Rather, it can be seen as a simplified or informal approximation of one. In this sequence, we have chosen to have students (re)create two commonly used rules of thumb use in the field to predict the rate of forward spread of a bushfire:
- The forward rate of spread of a fire in dry eucalypt forests is approximately 10% of the average 10 m open wind speed.
- The speed of a fire doubles for every 10o of upward slope.
These rules of thumb offer useful mental shortcuts for estimating fire behaviour in the field, particularly when data is limited and rapid decisions are needed.
In contrast, a mathematical model is a formal, quantitative tool that uses equations to describe, simulate, or predict real-world phenomena with greater precision. In the next lesson, students are introduced to a mathematical model, expressed as an equation, to estimate the rate of fire spread. The underlying data and reasoning behind the model are more complex than is typical at the secondary level, so students are not expected to construct the model themselves. Instead, they apply it and compare its output to that of the rule of thumb, highlighting the greater accuracy and reliability that formal models can provide.