Mathematical modelling: Playing with fire
View Sequence overviewA rule of thumb is a practical estimate based on observed data rather than precise calculation.
Repeated doubling of a fire’s speed leads to exponential growth rather than a simple linear increase, greatly amplifying outcomes such as impact and spread.
Whole class
Playing with fire PowerPoint
Playing with fire Spreadsheet (Teacher)
Each student
Playing with fire Spreadsheet (Student)
Access to computer, at least 1 between 3 students
Lesson
Show students slide 26 of Playing with fire PowerPoint to review the fire behaviour triangle. Remind students that they are investigating the influence of weather and topography (variables) on fire in dry eucalypt forests (constant).
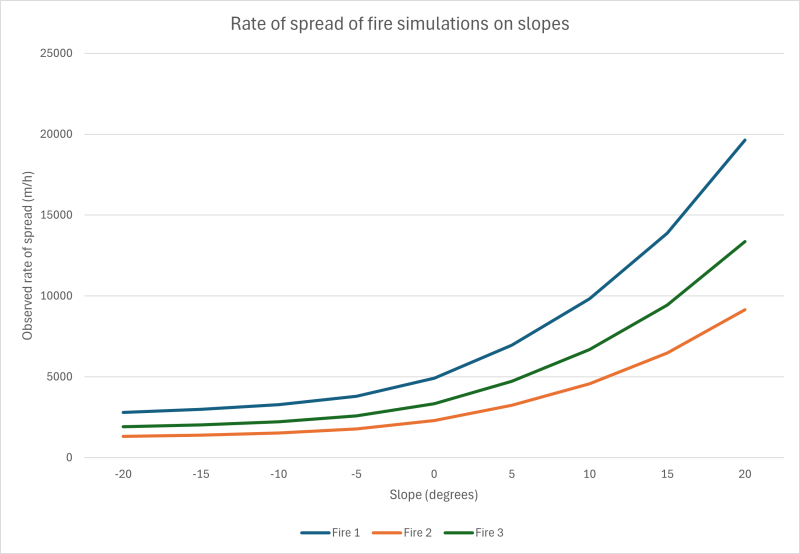
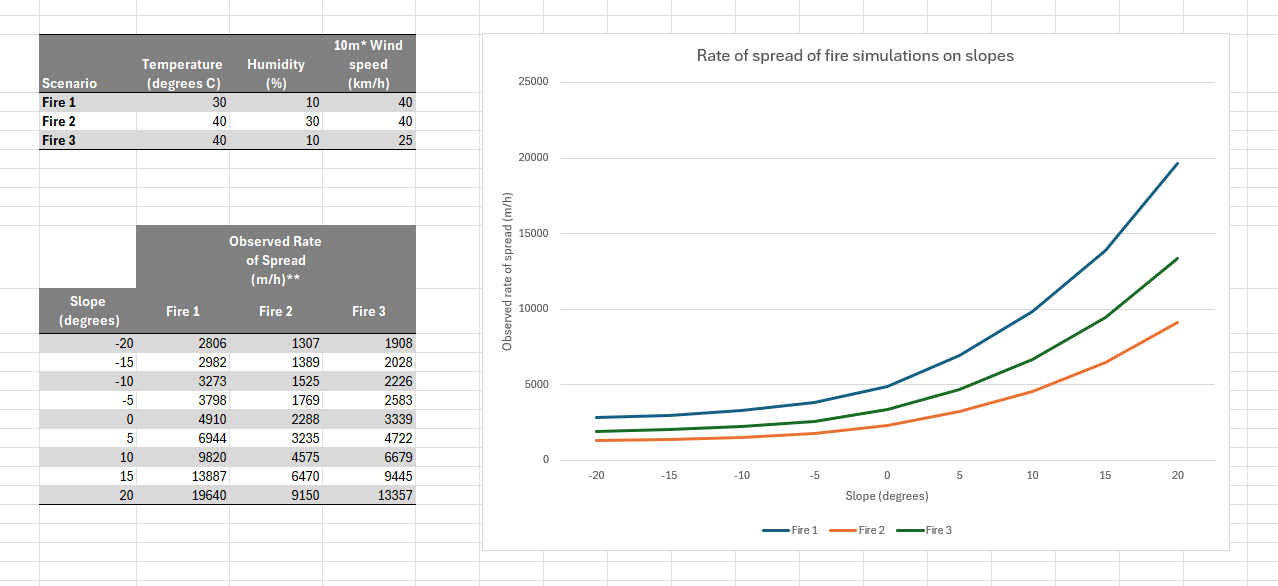
Show slide 27 and explain that it presents the weather conditions for three separate Spark fire simulations. For each simulation (Fire 1, Fire 2, and Fire 3), the fire was modelled on flat ground (0°), then on downward slopes (-5°, -10°, -15°, -20°), and finally on upward slopes (5°, 10°, 15°, 20°).
Discuss:
- Do you think fire would go faster, slower, or about the same speed when it is moving uphill? Why?
- If you predict the rate of spread will be faster or slower, by how much do you think it will change? What makes you think that?
- What might happen when the fire is moving downhill? Why?
- Do you think different weather conditions could further affect the rate of fire spread on slopes? Why or why not?
Allow students to share and discuss their thinking, without confirming whether their ideas are correct. These questions are the focus of investigation.
Spark is a wildfire simulation toolkit designed by the CSIRO. It simulates bushfires using topographical and weather data in conjunction with a range of mathematical models. Spark is designed to be used by bushfire researchers and also for emergency management agencies across Australia.
Spark uses a variety of mathematical models based on the latest research and fire conditions. Mathematical models for Spark are constantly being updated and redesigned. For example, Spark comes packaged with three different models for calculating the rate of spread of a bushfire, based on whether the environment is grassland, urban, or dry eucalypt forest.
The influence of slope

Slope plays a significant role in influencing a fire’s rate of forward spread, by changing how heat and flames interact with unburnt fuel. When a fire moves uphill, the slope brings the flames closer to the vegetation above, allowing radiant heat to preheat and dry the fuel more effectively. This increases the chances of ignition and causes the fire to spread more rapidly.
Examining the mathematical relationship between slope and fire spread rate allows the relationship to be quantified.
In this investigation, students examine the relationship between slope and fire spread rate to re-create commonly used rule of thumb: the speed of a fire approximately doubles for every 10 degrees of uphill slope (McArthur, 1968). For example, a fire travelling at 2 km/h on flat ground could spread at 4 km/h on a 10° slope and 8 km/h on a 20° slope. This demonstrates how slope can dramatically accelerate fire behaviour, particularly in hilly or mountainous terrain. While weather conditions such as wind, temperature, and humidity strongly influence fire spread more broadly, their effect on the relative rate of spread on slope is minimal. The doubling rule remains fairly consistent across different weather conditions.
Fires moving downhill spread more slowly, as the flames are angled away from the unburnt fuel, reducing preheating. However, the reduction in speed is much less than the increase observed uphill. On a 10° downhill slope, the rate of spread may decrease by around 10-20%, depending on factors such as wind, fuel type, and moisture (Sullivan et al., 2019).
Provide students with computer access and the Playing with fire Spreadsheet (Student). Ask students to open the third sheet, Topography data. This sheet displays data from the three Spark simulations, showing how the rate of spread changes with varying slope.
Show students slide 28 of Playing with fire PowerPoint. Ask students to discuss the questions by first looking at the numbers in the tables.
Next ask students to represent the data to show the relationship between the slope and the rate of spread of each fire. Allow students time to revise their answers to the questions on slide 28 if needed. The sheet Topography data in the Playing with fire Spreadsheet (Teacher) has a completed representation for reference.
Discuss:
- Does a fire spread faster, slower, or at about the same speed when moving uphill/downhill? By how much does the speed change on an upward/downhill slope?
- The speed of a fire tends to double for every 10 degrees of uphill slope.
- Fires spread more slowly downhill, however, the decrease in speed is small. For every 10 degrees of downhill slope, a fire can decrease in speed by approximately 20%.
- Do different weather conditions further affect the rate of fire spread on slopes?
- While weather conditions such as wind, temperature, and humidity strongly influence fire spread more broadly, their effect on the relative rate of spread on slope is minimal. The doubling rule remains consistent across different weather conditions.
- Is it possible to develop a rule of thumb for how slope affects a fire’s rate of spread?
- Show slide 29 of Playing with fire PowerPoint. Establish the rule of thumb that the speed of a fire doubles for every 10 degrees of uphill slope.
- How does the shape of this graph compare to the shape of the graph for the first rule of thumb? Why are the two graphs different?
- Show slide 30 of Playing with fire PowerPoint. The first graph suggested a linear relationship between wind speed and the observed rate of spread. The curve in the second graph indicates an exponential relationship between slope and rate of spread, as the rate doubles for every 10° of uphill slope but changes more gradually on downward slopes.
Two rules of thumb, two functions
Linear and exponential functions model different types of change. Linear functions have a constant rate of change: each increase in input leads to a constant change to the output. In contrast, exponential functions have a varying rate of change that increases or decreases over time. While linear change is additive, exponential change is multiplicative.
In this sequence, students encounter two rules of thumb:
- The forward rate of spread of a fire in dry eucalypt forests is approximately 10% of the average 10 m open wind speed.
- The speed of a fire doubles for every 10° of upward slope.
The first rule represents a linear relationship; the second is exponential. Graphing and comparing these functions help students visualise the difference. For many, this may be their first encounter with an exponential function, making it a powerful opportunity to build foundational understanding.
Show slide 31 of Playing with fire PowerPoint, which shows the following equations:
$$\text{Rate of spread (upward slope)} = R_0 \times 2^{(0.1\times\text{slope angle})}$$
$$\text{Rate of spread (downward slope)} = \frac{R_0 \times 2^{(0.1\times\text{slope angle})}}{2^{0.1\times(\text{slope angle}+10)}-1}$$
Explain that these equations are used by fire managers to calculate the rate of spread on upward and downward slopes for forest fires. Discuss how the equations are similar to and different from the rule of thumb.
These formulae were shared with us by Professor Jason Sharples (University of New South Wales, Canberra). They are also included in the Mathematics of Bushfires Year 9 classroom resources, authored by Professor Sharples and published by the University of Melbourne. These resources complement and can be used alongside this learning sequence.
Ask the students to open the sheet Topography estimates in the Playing with fire Spreadsheet (Student). Ask them to use Excel to calculate the rate of spread of fire using the rule of thumb and using the formula. For downward slopes, students can use the approximation that fires decrease in speed by 20% for each 10 degrees decline.
The sheet titled Topography estimates in the Playing with fire Spreadsheet (Teacher) is completed for reference.
This spreadsheet is more complex because the rate of change is not constant. Two different formulas are required—one to model fire spread on an upward slope, and another for a downward slope.
Rule of thumb
To calculate the forward rate of spread using the rule of thumb, we will be using the following formula:
$$\text{Rate of spread (upward slope)} = \text{Rate of spread on flat ground} \times 2^{(\text{incline}\times0.1)}$$
$$\text{Rate of spread (downward slope)} = \text{Rate of spread on flat ground} \times 0.8 ^ {(\text{incline} \times 0.1)}$$
To apply these formula in the spreadsheet, we can use the following formula:
=ROUND(IF(G5 >= 0, H9 * 2^(G5 / 10), H9 * (0.8)^(-G5 / 10)), 0)
Where:
- G5 = Slope in degrees
- H9 = Rate of spread on flat ground (0° slope).
- Note: A different H cell number will be needed for each fire. In the spreadsheet provided, H9 is the rate of spread on flat ground for Fire 1, H18 is Fire 2, and H27 is for Fire 3.
This formula:
- applies different formula depending on whether the slope is upward or downward.
- For upward slopes (G5 ≥ 0): The formula H9 * 2^(G5 / 10) models the rate of spread doubling for every 10° of incline.
- For downward slopes (G5 < 0): The formula H9 * (0.8)^(-G5 / 10) models the rate of spread slowing by 20% for every 10° of decline.
- uses ROUND(…, 0) to round the result to the nearest whole number.
Mathematical model
To calculate the forward rate of spread using the mathematical model, we will be using the following formula:
$$\text{Rate of spread (upward slope)} = R_0 \times 2^{(0.1\times\text{slope angle})}$$
$$\text{Rate of spread (downward slope)} = \frac{R_0 \times 2^{(0.1\times\text{slope angle})}}{2^{(0.1\times(\text{slope angle}+10)}-1}$$
To apply these formula in the spreadsheet, we can use the following formula:
=ROUND(IF(G5 >= 0, H9 * 2^(0.1 * G5), H9 * 2^(0.1 * -G5) / (2^(0.1 * (-G5 + 10)) - 1)), 0)
Where:
- G5 = Slope in degrees
- H9 = Rate of spread on flat ground (0° slope)
- Note: A different H cell number will be needed for each fire. In the spreadsheet provided, H9 is the rate of spread on flat ground for Fire 1, H18 is Fire 2, and H27 is for Fire 3.
This formula:
- applies different formula for upward and downward slopes.
- For upward slopes (G5 ≥ 0): The formula H9 * 2^(0.1 * G5) models exponential growth, with the rate doubling approximately every 10° of incline.
- For downward slopes (G5 < 0): The formula H9 * 2^(0.1 * -G5) / (2^(0.1 * (-G5 + 10)) - 1) slows the rate of spread more gradually, reflecting a decreasing but non-linear relationship as slope declines.
- uses ROUND(…, 0) to round the result to the nearest whole number.
Rule of thumb
A rule of thumb is a simplified guideline or approximation based on practical experience, observation, or empirical data. It provides a quick and easy way to estimate an outcome without the need for complex calculations.
It is important to note that a rule of thumb is not a mathematical model in the formal sense. Rather, it can be seen as a simplified or informal approximation of one. In this sequence, we have chosen to have students (re)create two commonly used rules of thumb:
- The forward rate of spread of a fire in dry eucalypt forests is approximately 10% of the average 10 m open wind speed.
- The speed of a fire double for every 10° of upward slope.
These rules of thumb offer useful mental shortcuts for estimating fire behaviour in the field, particularly when data is limited and rapid decisions are needed.
In contrast, a mathematical model is a formal, quantitative tool that uses equations to describe, simulate, or predict real-world phenomena with greater precision. The underlying data and reasoning behind the model are more complex than is typical at the secondary level, so students are not expected to construct the model themselves. Instead, they apply it and compare its output to that of the rule of thumb, highlighting the greater accuracy and reliability that formal models can provide.
In this lesson, students will observe that the rule of thumb and the mathematical model produce the same result, as the rule of thumb essentially uses a simplified version of the equation used by the model.
Discuss:
- What do you notice about the estimates using the equations and the observed rate of spread of fires?
- The results produced by the formula are the same as, or very close to, the observed rates of spread. This is because the simulations themselves are based on these underlying formulas.
- What do you notice about the approximations using the approximation that fire decreases by about 20% for each 10 degrees decline?
- The approximation that fire speed decreases by 20% for every 10° decline shows a noticeable discrepancy, indicating that it is not accurate.
- What do you notice about the approximations using the rule of thumb? Why might this be the case?
- For uphill slopes, the rule of thumb approximations are the same as the results produced by the formula, because they are (essentially) the same equation. Students can prove this by replacing the "slope angle" value with 10° and simplifying the equation.
- Comparing our two rules of thumb, which would you feel more confident using?
- Both rules of thumb are useful depending on the context they are used.
- While this rule of thumb appears more accurate than the rule of thumb regarding wind speed, it is important to note that the observed rate of spread is from fire simulations based on mathematical models, not actual fires. Real fires are very unpredictable.