

Space: Supermarket networks
View Sequence overviewNetworks can be used to model practical situations by representing important locations as vertices and connections between them as edges.
Connectedness describes whether all parts of a network can be reached through its edges.
Whole class
Supermarket networks Slides
Each student
Supermarket navigation Student sheet
Task
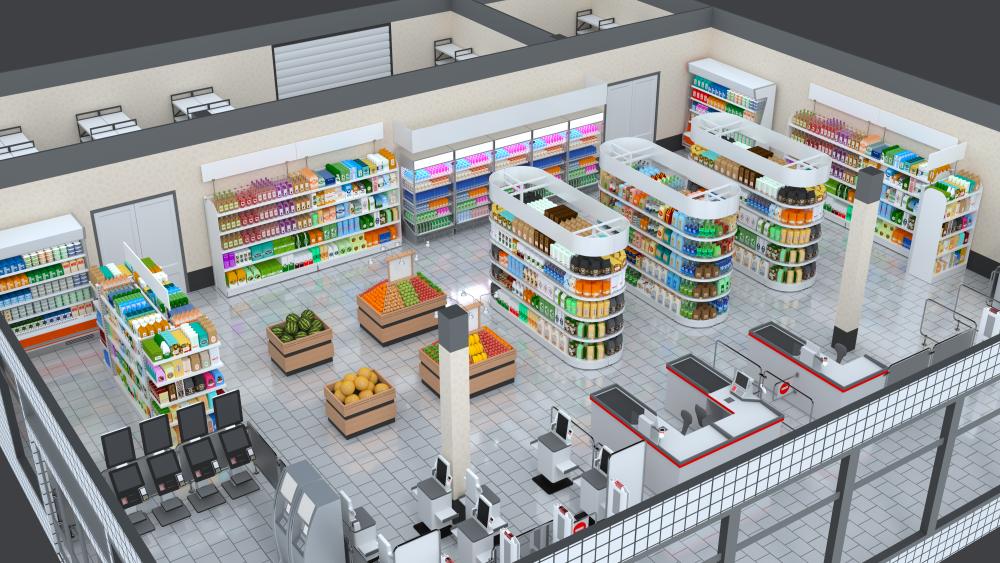
Show the supermarket image on Slide 3 of Supermarket networks Slides.
Set the scenario:
Imagine you are going into this supermarket for a quick shop. You want to get what you need, pay, and leave.
Ask:
- What decisions would you need to make as you move through the supermarket?
- What information can you see in the image?
- What information is missing?
- What might make this supermarket difficult to describe or navigate?
- We need to know where the entrance and exit are located.
- We need to know what we are buying.
- We need to know where the items are located.
- The image is 3D, so some paths are hidden.
- It is not clear which aisles connect.
- Different people might choose different routes.
- Some shelves block movement.
- Some parts of the supermarket are hard to describe precisely.
Explain that to plan a quick shop, more information is required. Specifically, what the customer is buying and where those items are located in the supermarket.
Ask:
- If you wanted to tell someone where an item was in this supermarket, how would you make sure they knew exactly where to go?
- For example, if I said “go to the shelf near the middle,” would everyone go to the same place?
Students should recognise that to describe a shopping trip clearly, the class needs a shared way to refer to locations, such as labelled shelves or areas.
Supermarket psychology
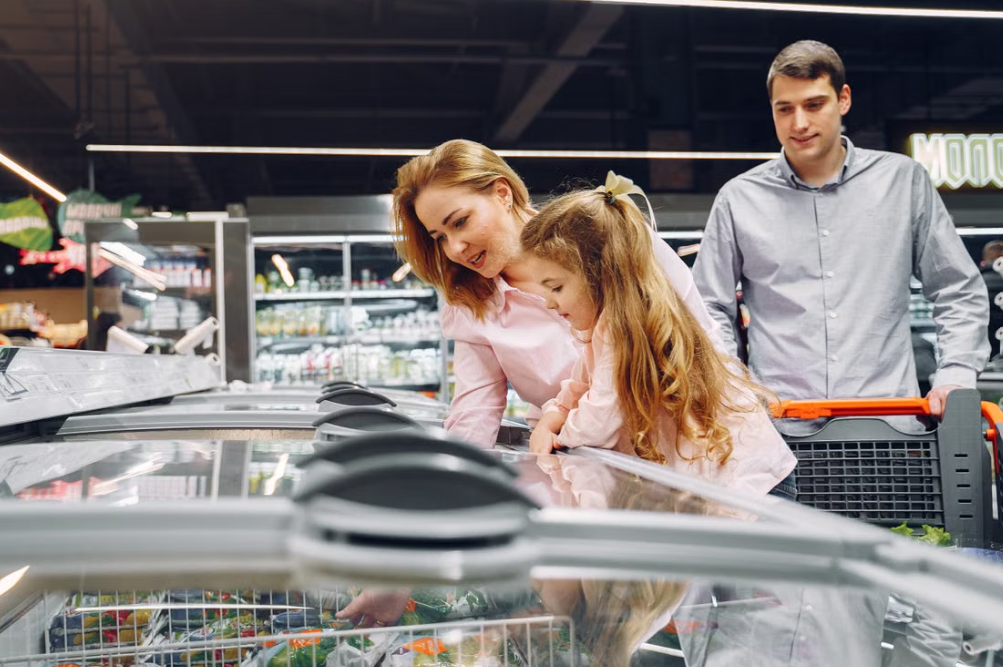
Supermarkets are not random spaces. Their layouts are carefully planned to shape how customers move through the store, where they pause, what they notice and how efficiently they can complete a shopping trip. This makes supermarket design a rich context for mathematical modelling, where different layouts can be represented, analysed and compared.
The following video and article provide accessible examples of the thinking behind supermarket design and can be used to spark student interest in why supermarket layouts are worth modelling mathematically.
Supermarket psychology
https://www.youtube.com/watch?v=g3IwOgA3Ngw
How supermarket design influences what you put in your trolley
https://www.abc.net.au/news/2022-11-12/how-supermarket-design-influences-what-you-buy-and-your-health/101612758
Supermarkets are not random spaces. Their layouts are carefully planned to shape how customers move through the store, where they pause, what they notice and how efficiently they can complete a shopping trip. This makes supermarket design a rich context for mathematical modelling, where different layouts can be represented, analysed and compared.
The following video and article provide accessible examples of the thinking behind supermarket design and can be used to spark student interest in why supermarket layouts are worth modelling mathematically.
Supermarket psychology
https://www.youtube.com/watch?v=g3IwOgA3Ngw
How supermarket design influences what you put in your trolley
https://www.abc.net.au/news/2022-11-12/how-supermarket-design-influences-what-you-buy-and-your-health/101612758
Show Slide 4.
Explain that important parts of the supermarket are now labelled and a shopping list has been created.
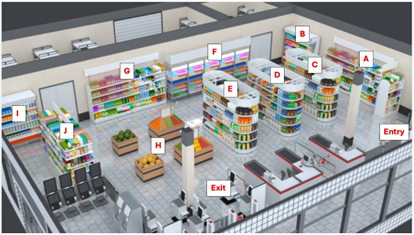
| Grocery item | Location |
|---|---|
| Ice cream | A |
| Yoghurt | F |
| Bread | J |
| Soap | D |
Invite students to write a short paragraph describing a route through the supermarket to collect the four items, pay, and leave. The description should be clear enough that someone else could follow the same route.
Bring the class together and ask one student to read their description while another student traces the route on the projected image.
Discuss any difficulties in clearly communicating the route:
- Did the description make it clear where the shopper started and finished?
- Did the shelf labels help?
- If the shopper needed soap from Location D, which side of the shelves would they access?
- If the shopper needed bread from Location J, where exactly would they go?
- Could two people follow the same description but take slightly different routes?
- What assumptions did the person tracing the route have to make?
Repeat with one or two other students, noting similarities and differences in the routes and descriptions. Draw out that the labelled areas helped students describe the locations of the items, but they did not fully solve the problem of describing the shopper’s movement.
This suggests that a simpler representation of the supermarket is needed: one that focuses on movement, where the shopper can travel, where choices are made, and how different parts of the supermarket connect.
Explain that the class now needs to decide what a simpler representation should show. The goal is not to copy every detail from the supermarket image, but to keep the information needed to describe movement clearly.
Discuss:
- What could we change about the supermarket image to make a shopper’s route easier to describe and follow?
- What information do we need to keep?
- What information can we ignore?
- Where does the shopper have choices about where to move next?
- Which parts of the supermarket need to be connected in our representation?
Students may suggest:
- using a 2D view instead of the 3D image.
- showing only the aisles and walkways.
- using straight vertical and horizontal lines for movement.
- marking places where routes meet or where choices are made.
- removing unnecessary visual detail such as the shelf details.
Explain that this process is called “abstraction”, where the real situation is simplified by keeping the information needed for the problem and leaving out details that are not needed.
Show Slide 5 and explain that the supermarket can be redrawn as a simpler 2D layout.
Note: The four fruit boxes are all labelled H because they are located at the same point in the supermarket. They are shown as separate points on the network diagram so that paths between the boxes can be represented.
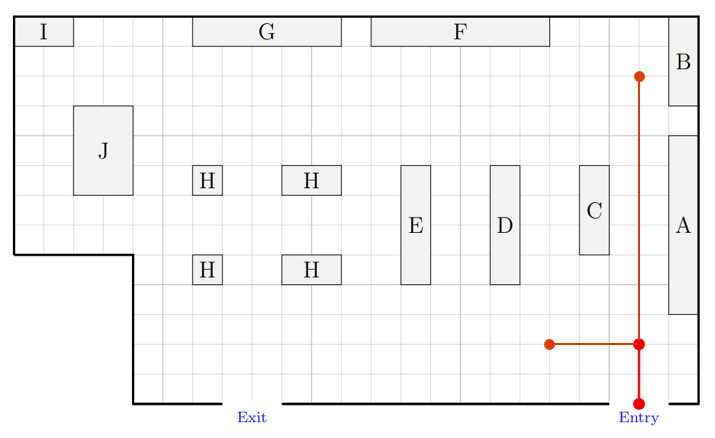
Draw attention to the red line that shows the shopper moving into the supermarket to the first decision point.
Ask: What choices does the shopper have once they are inside the supermarket?
The shopper can continue straight ahead or turn left. The animation on Slide 5 shows the two new lines created by this decision.
Explain that in a network, the dots or decision points are called “vertices”. The lines are called “edges” and are used to show possible movements between the vertices. This is the beginning of the network model used by mathematicians to describe movement between places.
Provide each student with the Supermarket navigation Student sheet.
Explain that the task is to turn the 2D supermarket layout into a network. Emphasise that there is not one single correct answer.
Allow students time to create a clear model that shows the main ways a shopper can move through the supermarket.
As students work, circulate and ask:
- What locations or decision points need to become vertices?
- What movements should be shown as edges?
- Can a shopper use your network to move from the entrance to the checkout?
- Are there any important pathways missing?
- Would another person be able to follow a route using your network?
Encourage students to keep their network clear and readable. Using mostly horizontal and vertical lines can help with this. The network does not need to show every detail of the supermarket, but it should show the main places where a shopper can move, turn or make a choice.
Ask: Could someone else use your network to describe a route through the supermarket?
Students should recognise that the vertices need labels. Ask students to create a clear labelling system for their vertices. Remind them that the labels A–J have already been used for locations, so their vertex labels should use a different system.
Students should then use their labelled network to describe a route that collects the four items on the worksheet.
Have students swap with a partner and test whether their partner can follow the route using only the labelled network.
Discuss: What made a network easy or difficult to follow?
Students may identify the following factors:
- decision points were clear.
- edges showed where movement was possible.
- labels were organised.
- the route description matched the network.
- too many or too few vertices made the network harder to use.
Networks vocabulary
Everyday words such as point, line, edge, route and connected can mean something more precise in network contexts. Helping students use this vocabulary carefully supports clearer mathematical reasoning.
A network, or graph, is a mathematical model used to represent connections. It is made up of vertices and edges. A vertex is a point that represents a location or decision point. An edge is a line that represents a connection or pathway between vertices.
A path is a route through the network that follows a sequence of edges. Networks can be undirected, where each edge can be travelled in either direction, or directed, where arrows on edges indicate that movement is permitted in one direction only. In a supermarket, most aisles are undirected, but one-way sections or entry and exit points might be modelled as directed edges.
Everyday words such as point, line, edge, route and connected can mean something more precise in network contexts. Helping students use this vocabulary carefully supports clearer mathematical reasoning.
A network, or graph, is a mathematical model used to represent connections. It is made up of vertices and edges. A vertex is a point that represents a location or decision point. An edge is a line that represents a connection or pathway between vertices.
A path is a route through the network that follows a sequence of edges. Networks can be undirected, where each edge can be travelled in either direction, or directed, where arrows on edges indicate that movement is permitted in one direction only. In a supermarket, most aisles are undirected, but one-way sections or entry and exit points might be modelled as directed edges.
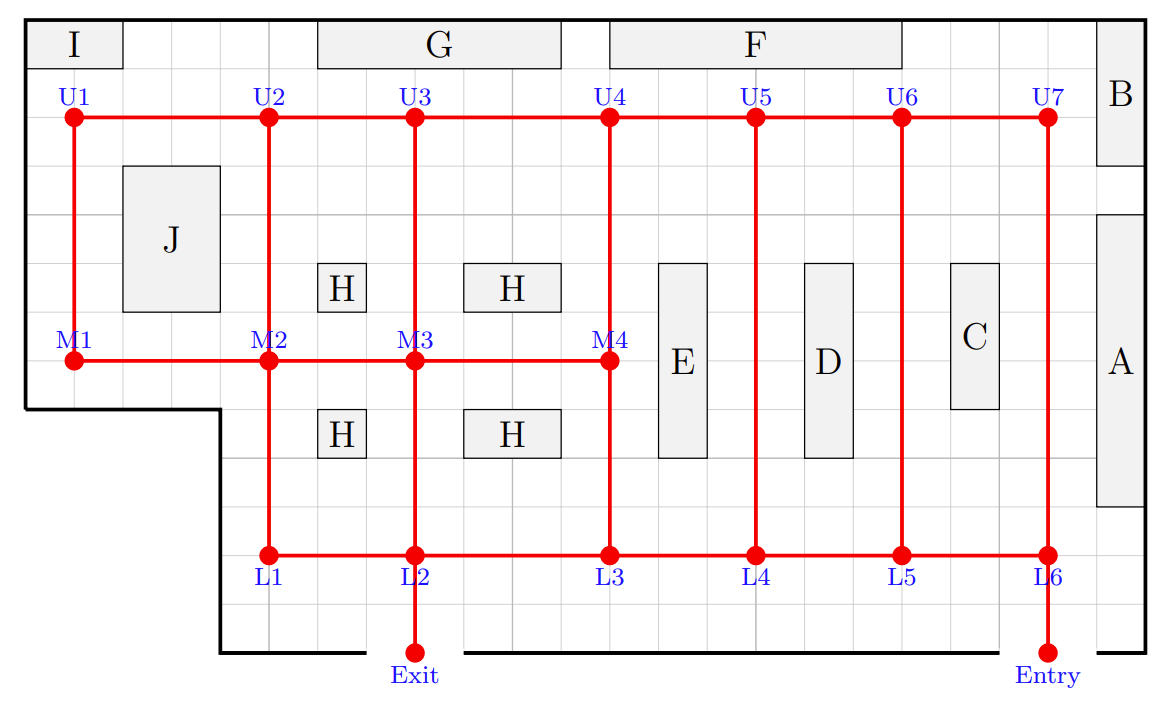
Show Slide 6 and explain that this is one possible network representation of the supermarket. Students may have created different networks, but each network should aim to show the main decision points and possible movements.
Discuss:
- What system has been used for labelling the vertices?
- U = upper row, M = middle row, L = lower row.
- Numbers increase from left to right.
- Why is it useful to label vertices in an organised way?
- Students should recognise that the labels make it easier to describe a route, compare networks, and refer to particular edges.
- What are some limitations of this network compared with the real supermarket?
- Shoppers may stop halfway along an aisle.
- Shoppers may turn around before reaching the next vertex.
- Item locations are more detailed than the network shows.
- The network ignores width, crowds, displays and other real-world details.
Emphasise that these limitations do not stop the network from being useful. It means the network is a simplified model. It keeps the information we need to describe movement and connectedness, but leaves out some real-world detail.
Isomorphic graphs
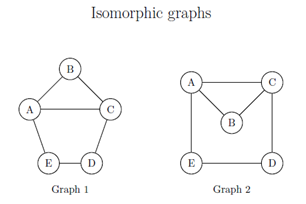
Network diagrams can look different but still represent the same structure. This is useful when comparing students’ diagrams because different drawings are not necessarily different mathematical models.
Isomorphic graphs are graphs that are structurally identical. They contain the same number of vertices and edges, connected in the same way, but may differ in how they are drawn or labelled.
Isomorphism matters because many real-world situations can be represented in different-looking ways while keeping the same underlying structure. For example, in chemistry, molecules can be represented as graphs where atoms are vertices and bonds are edges. Two diagrams may look different but still represent the same molecule if the bonding structure is the same.
In this task, students may place vertices in different positions or use different labels, but their networks can still be equivalent if the same decision points are connected in the same way. The focus should be on whether the network accurately represents movement through the supermarket, not whether it looks exactly like the teacher example.
Network diagrams can look different but still represent the same structure. This is useful when comparing students’ diagrams because different drawings are not necessarily different mathematical models.
Isomorphic graphs are graphs that are structurally identical. They contain the same number of vertices and edges, connected in the same way, but may differ in how they are drawn or labelled.
Isomorphism matters because many real-world situations can be represented in different-looking ways while keeping the same underlying structure. For example, in chemistry, molecules can be represented as graphs where atoms are vertices and bonds are edges. Two diagrams may look different but still represent the same molecule if the bonding structure is the same.
In this task, students may place vertices in different positions or use different labels, but their networks can still be equivalent if the same decision points are connected in the same way. The focus should be on whether the network accurately represents movement through the supermarket, not whether it looks exactly like the teacher example.
Introduce a new scenario: There has been a spill in the aisle near the shelves at C, completely blocking the walkway between C and the front wall. Point to the approximate location on the network on Slide 6.
Ask: What change should be made to the network diagram to represent this situation?
Students should recognise that the edge connecting L6 and L5 should be deleted or crossed out.
Show Slide 7 with the deleted edge and ask students to erase or cross out the matching edge on their own network, or the closest corresponding edge if their labelling system is different.
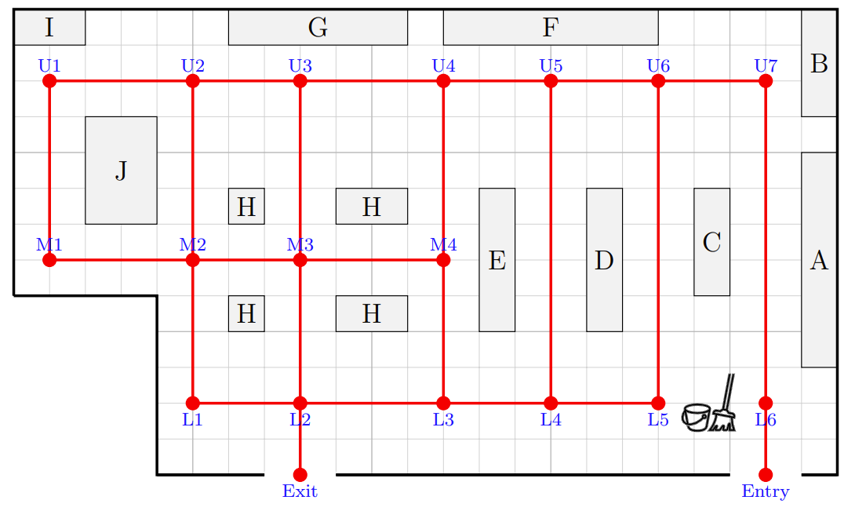
Ask: How might this change to your network affect customer movement in the supermarket?
Give students a couple of minutes to test their own network and investigate what has changed. Encourage them to trace possible routes and look for places where movement is now different.
Ask:
- What routes are no longer possible?
- What alternative routes can still be used?
- Can each represented decision point still be reached?
- Has any part of the supermarket model been cut off?
Bring the class together and discuss what students noticed.
Draw out that although one pathway has been blocked, there are still other ways around. Every represented part of the supermarket can still be reached, so the network is still connected.
Formalise the network language: A network is “connected” if there is a path between every pair of vertices.
Discuss:
- Which pathways might become busier now that this pathway has been blocked?
- Does “connected” mean that movement is just as easy as before?
Draw out that connectedness tells us whether movement is still possible, but it does not tell us whether movement is equally easy or efficient. A network can stay connected even when some routes become less direct or more congested.
Reset the scenario:
During overnight cleaning and restocking, some aisles need to be closed so staff can clean or move supply boxes. However, staff still need to be able to move through the supermarket and reach every vertex in the network.
Show Slide 8 and explain that each diagram shows the network with additional pathways blocked and edges deleted.
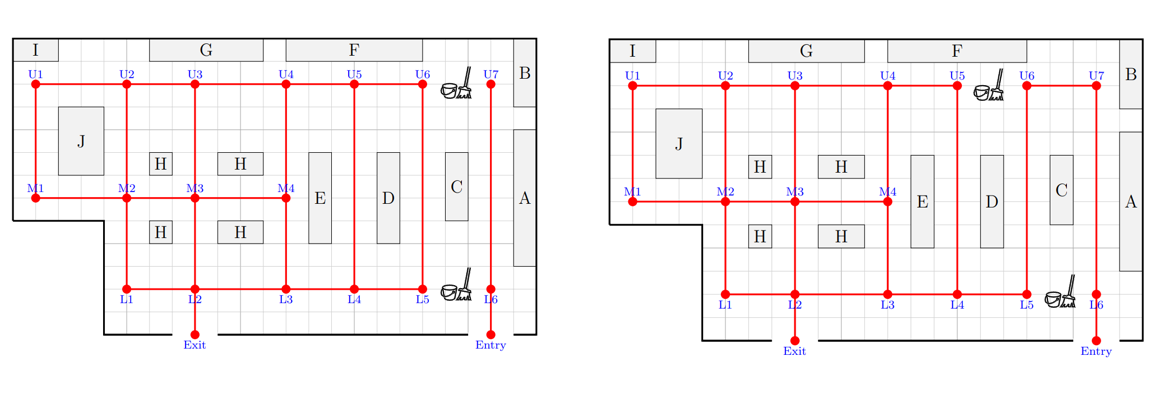
Ask:
- Can customers still move between all parts of the supermarket?
- Has any part of the network been cut off?
- Is there still a path from entry to exit?
Then pose the challenge: On your own network, remove as many edges as possible while still keeping every vertex connected.
Students work on the network they have already drawn, lightly crossing out edges to be removed.
As students work, circulate and ask questions such as:
- After this edge is removed, can every vertex still be reached?
- Has any part of the network become isolated?
- Are there any edges that definitely cannot be removed?
- Are there any edges that seem safe to remove? What makes them safe?
- Are you testing randomly, or are you starting to use a strategy?
Students continue removing as many edges as possible while keeping the network connected.
Bring the class back together after students have tested which edges can be removed while keeping their network connected.
Discuss:
- Which edges were you able to remove?
- Which edges had to stay?
- How did you know when removing an edge had broken the network?
Draw out the idea that some edges can be removed because there is still another way around, but other edges are essential because removing them isolates part of the network.
The remaining part of this step is optional if time permits. It extends the idea of connectedness by exploring what happens when a connected network is reduced as much as possible, leading to the relationship between the number of vertices and edges in a spanning tree. This optional content is not required for the later tasks in the sequence.
Ask students to count and record:
- the number of vertices in their network.
- the number of edges remaining after removing as many edges as possible while keeping the network connected.
Record the class results in a table on the board.
| Number of vertices | Number of edges remaining |
|---|---|
Discuss:
- Is there a relationship between the number of vertices and the number of edges that remain?
- Students should notice that when as many edges as possible are removed, the number of edges remaining is one less than the number of vertices.
- Why do you think that relationship exists?
- What happens if we remove one more edge?
Draw out the conclusion that once the network has been reduced as much as possible, every remaining edge is essential. If one more edge is removed, at least one vertex or section of the network becomes disconnected. Earlier, some edges could be removed because there was still another way around, but after removing as many edges as possible, those extra alternatives are gone.
Introduce the formal language: In network language, an extra way around is called a “cycle”. A cycle is a path that returns to its starting vertex without retracing an edge. A connected network that includes all the vertices but has no cycles is called a “spanning tree”.
Then confirm the observed relationship: For a spanning tree with $n$ vertices, there are $n -1$ edges.
Another useful way to think about this relationship is to imagine building the connected network starting with a single vertex. This first vertex does not need an edge. Each new vertex added to the network will need one edge to connect it to the network. So:
1 vertex → 0 edges
2 vertices → 1 edge
3 vertices → 2 edges
This helps explain why a spanning tree with $n$ vertices has $n - 1$ edges.
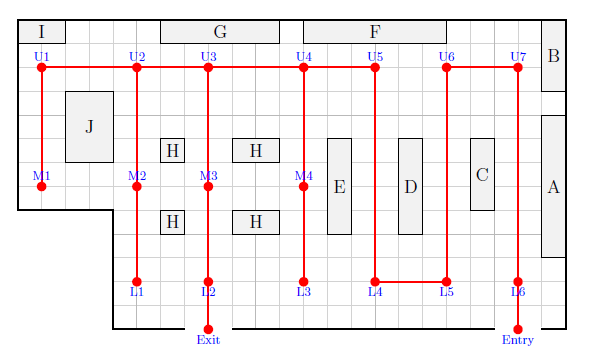
Different spanning trees can look different, but the same relationship holds.
Spanning tree algorithms
A spanning tree is a connected version of the network that includes all vertices but has no cycles. A cycle in a network is a path that starts and ends at the same vertex, without repeating any other vertex along the way.
One way to create a spanning tree is to remove edges one at a time while keeping the network connected.
Algorithm for creating a spanning tree by deleting edges
- Find a cycle in the network.
- Choose one edge in that cycle.
- Delete that edge if the network stays connected.
- Repeat until there are no cycles left.
A spanning tree is a connected version of the network that includes all vertices but has no cycles. A cycle in a network is a path that starts and ends at the same vertex, without repeating any other vertex along the way.
One way to create a spanning tree is to remove edges one at a time while keeping the network connected.
Algorithm for creating a spanning tree by deleting edges
- Find a cycle in the network.
- Choose one edge in that cycle.
- Delete that edge if the network stays connected.
- Repeat until there are no cycles left.
Bring the lesson back to the original problem of describing movement through a supermarket.
Discuss:
- How did our representation change from the original supermarket image to the final network?
- Why was the network easier to use than the original image?
- What does it mean for a network to be connected?
- What is special about a spanning tree?
Draw out that the network is a simplified model of the supermarket. By representing important locations as vertices and possible movements as edges, the network keeps the key information about movement, decision points and connections. It ignores unnecessary details but still allows us to describe routes, identify blocked pathways, and check whether all parts of the model remain connected.
Recap the lesson goal: Networks can be used to model movement and connectedness by simplifying a real-world layout into important locations, pathways and decision points.