

Space: Supermarket networks
View Sequence overviewNetworks can be used to model how customers move through different queueing systems, with the structure of the network affecting waiting times and efficiency.
Mathematical models can be refined by changing assumptions and conditions to better represent and compare real-world systems.
Whole class
Supermarket networks Slides
Each student
A device with internet access
Supermarket queue type Student sheet
Supermarket queue type Spreadsheet
Supermarket queue simulation Spreadsheet
Task
Set the scene:
The supermarket manager has noticed long delays at the checkouts after school and in the early evening. Some customers complain that the queues are too long, while others complain that one checkout always seems much slower than the others. The manager wants to know whether a different checkout arrangement would reduce waiting times.
Ask:
- What different checkout arrangements are used in supermarkets?
- When there are separate queues, is the queue with the fewest people always the quickest?
- How could a supermarket decide which checkout arrangement works better?
Focus the discussion on two systems:
- separate queues for each checkout.
- one shared queue feeding multiple checkouts.
Pose the problem: Which checkout arrangement is more efficient: separate queues or one shared queue?
Draw out that “more efficient” could mean different things, but in this task, the comparison will focus on customer waiting time.
Explain that to compare the two checkout systems fairly, the model needs a clear set of assumptions and rules. The model will include only the information needed to test waiting time, while leaving out details that can be added later.
Ask:
- What information is needed to compare the two checkout systems fairly?
- What should stay the same in both systems?
- What can be ignored for now?
Draw out that the model should use:
- the same customers.
- the same service times.
- two checkouts.
- one queue arrangement at a time.
- waiting time as the measure for comparison.
Acknowledge that some real-world factors will be left out for now, such as customers changing queues, different cashier speeds, payment method, walking time and social behaviour. Explain that these factors are not unimportant, but they are being left out, so the first model is manageable.
Conclude:
To compare the systems fairly, the same customers and service times will be used for both systems. The only feature being changed is the queue arrangement.
Explain that to compare the two checkout arrangements fairly, the model needs clear rules.
Show Slide 33 and compare the rules for the model.
| Shared queue | Individual queues |
|---|---|
|
|
Pose the question: Which system do you predict will have the lower average waiting time? Why?
Have students vote for which system they think will have the lower average waiting time (individual queues/shared queue/both the same) and tally the predictions on the board.
Explain that the next step is to test these predictions using a sample of eight customers and the same service times for both systems. Eight customers are enough to show how the queue rules affect waiting time, but it is still small enough to calculate by hand. This makes the comparison fair because the only feature being changed is the queue arrangement.
Allocate students to groups and provide each student the Supermarket queue type Student Sheet.
Show Slide 34. Explain that we will use an animation to model individual queues, and that the model uses the same eight customers and service times shown on the worksheet.
Throughout the demonstration, anticipate that students may have questions about how realistic the modelling process is. If these arise, acknowledge that the model makes some simplifying assumptions, including:
- Moving into a queue or from the front of the queue to a checkout takes 0 seconds.
- Customers choose the shorter queue without knowing future service times.
Use the animation on the slide to model the movement of the first customer. Pause and have the students record the relevant values in the individual queues table:
| Customer | Service time (s) | Checkout | Start time (s) | Finish time (s) | Waiting time (s) |
|---|---|---|---|---|---|
| 1 | 60 | 1 | 0 | 60 | 0 |
Repeat for the second and third customers, spending time to ensure that students understand why Customer 3 must wait 30 seconds for Customer 1 to be finished before they can be served. Confirm the values together, then allow students to continue the individual queues table independently or in pairs.
| Customer | Service time (s) | Checkout | Start time (s) | Finish time (s) | Waiting time (s) |
|---|---|---|---|---|---|
| 1 | 60 | 1 | 0 | 60 | 0 |
| 2 | 80 | 2 | 0 | 80 | 0 |
| 3 | 30 | 1 | 60 | 90 | 30 |
Slide 35 is available with the completed solution that gives an average waiting time of 106.25 seconds.
Then show Slide 36 with the shared queue animation. Repeat the same process to model the first three customers and complete the table.
| Customer | Service time (s) | Checkout | Start time (s) | Finish time (s) | Waiting time (s) |
|---|---|---|---|---|---|
| 1 | 60 | 1 | 0 | 60 | 0 |
| 2 | 80 | 2 | 0 | 80 | 0 |
| 3 | 30 | 1 | 60 | 90 | 60 |
Use the animations to pause and ask:
- Which customer is served next?
- Which checkout does the customer go to?
- When does the customer start being served?
- When does the customer finish?
- How long does the customer wait?
Students then calculate the average waiting time for each system and decide which arrangement was more efficient for this set of customers.
Slide 37 is available with the completed solution that gives an average waiting time of 102.5 seconds.
As groups work, circulate and ask questions such as:
- Which customer is next in this queue?
- Which checkout becomes available first?
- When can this customer start being served?
- How is the finish time calculated?
- How is the waiting time calculated?
- Which system appears to reduce waiting time, and why?
Once groups have completed the tables, allow them to use the Supermarket queue type Spreadsheet to check their calculations. The expected results are:
- Individual queues: average waiting time = 106.25 seconds
- Shared queue: average waiting time = 102.5 seconds
Point out that the difference in average waiting time is small. This single example does not provide enough evidence to conclude that one queue arrangement is generally more efficient, so further testing is needed.
Explain that the spreadsheet can be used to test what happens when the model changes. To keep the investigation focused, students should choose one question to investigate and change only one feature at a time.
This keeps the focus on modelling and testing the two checkout arrangements, with the spreadsheet used as a check and quick exploration tool rather than replacing the modelling.
- Does the shared queue still have the lower average waiting time when there are more customers?
- What happens if one customer has a much longer service time?
- What happens if all service times are similar?
- What happens if the service times vary a lot?
- Are there situations where individual queues and shared queues give similar results?
Students should record at least two trials, including what they changed, what happened to the average waiting time, and what this suggests about the two systems.
Bring the class back together and compare findings from the two queue systems.
Discuss:
- Which system had the lower average waiting time in the original eight-customer model?
- What did you change in the spreadsheet investigation?
- What did you keep the same so the comparison was fair?
- Did the shared queue always have a lower or equal average waiting time in your trials?
- Why might the shared queue reduce waiting time?
- Does this model prove that shared queues are always better in the real world? Why or why not?
Draw out that the spreadsheet allowed the model to be tested under different conditions. The shared queue often reduces waiting time because the next customer can go to whichever checkout becomes available first, rather than being stuck in one line. However, the conclusion depends on the assumptions in the model, such as identical checkout speeds, fixed service times, and no customers changing queues.
Show Slide 38 and explain that both checkout systems can be represented as directed networks. The arrows show the direction customers move through the checkout system.
In individual queues, customers split into separate lines before being served. In a shared queue, customers stay in one line and move to the next available checkout.
Conclude:
This first model suggests that the shared queue can reduce waiting time, but the model is still very simple because all customers arrive at once. Next, the model will be refined so customers arrive over time.
Why do shared queues have an advantage?
In the simplified model, the shared queue has a mathematical advantage because it keeps both checkouts working whenever customers are waiting. Separate queues can leave one checkout idle while customers are still waiting in another queue.
This happens because customers in separate queues are locked into one line. If Checkout 1 has a customer with a long service time and Checkout 2 finishes quickly, Checkout 2 may become free even though customers are still waiting in the other line. In a shared queue, the next customer simply goes to the next available checkout, so this wasted waiting time is avoided.
For example, suppose three customers have service times of 100 s, 10 s and 10 s. With separate queues, Customer 1 and Customer 3 might be assigned to Checkout 1, while Customer 2 goes to Checkout 2. Customer 3 waits 100 s. With a shared queue, Customers 1 and 2 start immediately, and Customer 3 starts when Checkout 2 becomes available after 10 s. The waiting time is much lower.
So, under this model, the shared queue will be better or equal for average waiting time. It is equal only when the separate queues happen to balance perfectly, so that no checkout is idle while customers are waiting elsewhere. This conclusion depends on the model assumptions: identical checkouts, fixed service times, no queue-changing, and customers being served in order.
In the simplified model, the shared queue has a mathematical advantage because it keeps both checkouts working whenever customers are waiting. Separate queues can leave one checkout idle while customers are still waiting in another queue.
This happens because customers in separate queues are locked into one line. If Checkout 1 has a customer with a long service time and Checkout 2 finishes quickly, Checkout 2 may become free even though customers are still waiting in the other line. In a shared queue, the next customer simply goes to the next available checkout, so this wasted waiting time is avoided.
For example, suppose three customers have service times of 100 s, 10 s and 10 s. With separate queues, Customer 1 and Customer 3 might be assigned to Checkout 1, while Customer 2 goes to Checkout 2. Customer 3 waits 100 s. With a shared queue, Customers 1 and 2 start immediately, and Customer 3 starts when Checkout 2 becomes available after 10 s. The waiting time is much lower.
So, under this model, the shared queue will be better or equal for average waiting time. It is equal only when the separate queues happen to balance perfectly, so that no checkout is idle while customers are waiting elsewhere. This conclusion depends on the model assumptions: identical checkouts, fixed service times, no queue-changing, and customers being served in order.
Explain that the first model assumed all customers arrived at the checkout area at the same time. To make the model more realistic, customers will now arrive gradually over time.
Show the staggered arrival times on Slide 39. Explain that the same service times will be used, but customers now arrive every 30 seconds instead of all at once.
Discuss the key changes to the model:
- a customer cannot start being served before they arrive.
- a customer’s start time is the later of the customer’s arrival time and the checkout’s available time.
- $\text{waiting time} = \text{start time} − \text{arrival time}$.
Model the first one or two customers with the class using the animation on Slide 39, then have students complete the table on page 2 of Supermarket Queue type Student Sheet.
As students work, circulate and ask:
- Has the customer arrived yet?
- Which checkout becomes available first?
- Can the customer start before their arrival time?
- What is the later time: the customer’s arrival time or the checkout’s available time?
- When does the customer start being served?
- When does the customer finish?
- How long did the customer wait before service began?
Emphasise the key calculations:
- start time = later of arrival time and checkout available time
- $\text{finish time} = \text{start time} + \text{service time}$
- $\text{waiting time} = \text{start time} − \text{arrival time}$
Watch for students calculating the waiting time using $\text{finish time} − \text{arrival time}$. This gives the total time in the checkout system, not the waiting time.
Show Slide 40 with the solutions and the average waiting time of 15 seconds.
Discuss:
- What changed when customers arrived over time?
- Did the shared queue still have the lower average waiting time?
- Why might the result change when the model becomes more realistic?
Conclude:
The model has now been refined by adding arrival times. This helps test whether the first conclusion still holds under more realistic conditions.
Start simple, then refine
Real-world problems are often too messy to model all at once. A powerful teaching move is to begin with a simpler version that students can understand, test and discuss, then gradually add complexity as the need for a better model becomes clear.
In this task, students first compare a simplified checkout model where all customers are already at the checkout area, all checkout operators are assumed to process customers at the same rate, and each customer has a fixed service time. This helps students focus on how the queueing rules work, how waiting time is calculated, and what the model is actually comparing.
The model is then refined by staggering arrival times and later using a spreadsheet simulation to test larger and more realistic situations. Each refinement gives students a reason to rethink the model and test whether their conclusions still hold.
The key pedagogical idea is that simplification is not dumbing the mathematics down. It is a deliberate teaching move that helps students build a clear model that is strong enough to support later complexity.
Real-world problems are often too messy to model all at once. A powerful teaching move is to begin with a simpler version that students can understand, test and discuss, then gradually add complexity as the need for a better model becomes clear.
In this task, students first compare a simplified checkout model where all customers are already at the checkout area, all checkout operators are assumed to process customers at the same rate, and each customer has a fixed service time. This helps students focus on how the queueing rules work, how waiting time is calculated, and what the model is actually comparing.
The model is then refined by staggering arrival times and later using a spreadsheet simulation to test larger and more realistic situations. Each refinement gives students a reason to rethink the model and test whether their conclusions still hold.
The key pedagogical idea is that simplification is not dumbing the mathematics down. It is a deliberate teaching move that helps students build a clear model that is strong enough to support later complexity.
Explain that the hand calculations helped test small models, but a spreadsheet makes it possible to test larger and more realistic checkout systems.
Demonstrate the basic features of the Supermarket queue simulation Spreadsheet.
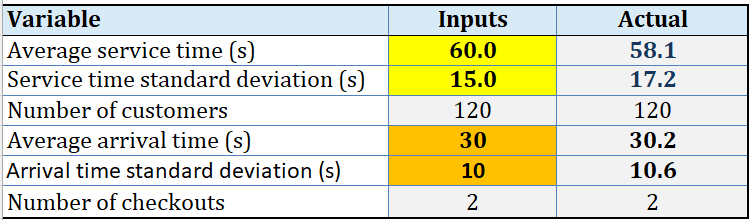
Explain that students can use the spreadsheet to vary:
- average service time.
- arrival rate of customers.
- variation in service times.
- number of customers.
Show Slide 41 and ask students to investigate:
- How does the average service time affect waiting times?
- How does the arrival rate of customers affect waiting times?
- When do waiting times become too large?
- Which queue arrangement would you recommend to the supermarket manager?
Encourage students to use “change one factor at a time” as a starting strategy, so the impact of each change can be observed more clearly.
Students record a recommendation on their Student sheet, supported by evidence from the spreadsheet.
Bring the class back together and have selected groups share their findings from the spreadsheet investigation.
Discuss:
- Which queue arrangement would you recommend?
- What evidence from the spreadsheet supports your recommendation?
- Did changing service time or arrival rate affect the result?
- What are the limitations of the model?
Conclude:
Our first model compared queue structures using the same customers and service times. The refined model added arrival times, and the spreadsheet allowed us to test larger and more realistic situations. The key insight is that waiting time depends on how quickly customers arrive compared with how quickly they can be served.
Show Slide 42, which summarises the computational thinking processes explored across the sequence. Each task involved taking a complex real-world situation and turning it into a simpler model that could be tested, refined and used to make decisions.
Across this sequence, students develop and refine network models through:
- representing supermarket movement using networks.
- counting possible paths through a network using a branching algorithm.
- adding weights to compare shortest paths.
- modelling customer flow through checkout systems.
- using digital tools to test larger and more realistic situations.
Discuss how these tasks involved:
- abstraction — deciding what information to keep and what to ignore.
- decomposition — breaking large problems into smaller parts.
- pattern recognition — noticing structure and repeated decisions.
- algorithm design — creating step-by-step methods.
- testing and refining — checking whether a method or model still works when conditions change.
- digital tools — using simulations to explore cases that are too large to test by hand.
Conclude:
Computational thinking helps us turn complex real-world situations into mathematical models that can be tested and improved. The models are not perfect copies of reality, but they help us understand the situation, compare options and justify decisions using evidence.