

Space: Supermarket networks
View Sequence overviewEdges in a network can carry numerical values, called weights, that represent real-world quantities such as distance or time.
The shortest path in a weighted network is found by comparing total edge weights, not the number of edges.
Whole class
Supermarket networks Slides
Each student
Supermarket shortest path Student sheet
Task
Show Slide 18 of Supermarket networks Slides which displays the supermarket network from the previous task, with the spill still blocking the edge between L6 and L5.
Remind students that in the previous task, the class found that there were many possible paths from Entry to Exit. Those paths were counted by using a branching algorithm and breaking the network into smaller subnetworks.
Reset the scenario:
The security guard has many possible paths from Entry to Exit. It is now almost the guard’s lunch break, and the supermarket manager asks for one final quick inspection before the guard leaves. This time, the aim is not to stay unpredictable, but to find the shortest path through the supermarket.
Ask:
- What might “shortest path” mean in this situation?
- Can the current network tell us which path is shortest? Why or why not?
- Would the shortest path always be the quickest path?
- What information is missing from the network if the goal is to find the shortest distance?
Draw out that “shortest” could mean different things in a real situation. The quickest path might depend on crowds, blocked aisles, walking speed or checkout congestion. These factors are important, but for this model, the focus will be on distance travelled.
Ask: Where should the distance information be shown on the network? Why?
Introduce the language:
In a “weighted network”, each edge has a numerical value, called a “weight”. The weight is written on or beside the edge. In this lesson, the weights represent distance. The distance of a path is found by adding the weights of the edges travelled.
Show Slide 19, which adds labels to the first three edge lengths. Explain that the network can now be used to represent distance. For this model, each grid square represents one metre, so the length of an edge can be found by counting the number of grid squares between vertices.
Give each student the Supermarket shortest path Student sheet.
Ask students to label the length of each edge on the supermarket network.
When students have labelled each edge, continue the animation on Slide 19 to show a completed version of the network to allow students to check their distances.
Challenge students to find the shortest path, or paths, from Entry to Exit. Explain that the distance of a path is found by adding the distances of the edges travelled.
Students record their shortest path or paths, the total distance, and how they know the distance is shortest.
In a weighted network, the distance of a path is found by adding the weights of the edges travelled. The shortest distance is the smallest total weight. The shortest path is the route that gives this total. There may be more than one shortest path with the same shortest distance.
As students work, circulate and ask questions such as:
- Which parts of the route are forced?
- Where does the path first have a choice?
- Does the path with fewer edges always have the shortest distance?
- Which edges are clearly longer than others?
- How is the total distance of the path being checked?
- Could there be more than one path with the same shortest distance?
Students who finish early can be encouraged to create a table showing the shortest distance from Entry to each vertex. This is not needed to identify the shortest Entry-to-Exit path, but it begins to show how shortest-path information can be organised across the whole network.
| Vertex | Shortest distance |
|---|---|
| U1 | 31 |
| U2 | 27 |
| U3 | 24 |
| U4 | 20 |
| U5 | 17 |
| U6 | 14 |
| U7 | 11 |
| M1 | 36 |
| M2 | 32 |
| M3 | 29 |
| M4 | 25 |
| L1 | 36 |
| L2 | 33 |
| L3 | 29 |
| L4 | 26 |
| L5 | 23 |
| L6 | 2 |
| Exit | 35 |
Bring the class together and compare student responses.
Discuss:
- What was the first shortest path you found? What was the total distance of this path?
- How did you find other paths of the same length?
- Did all the shortest paths have the same number of edges?
- How can we be confident that no shorter path has been missed?
Students should identify that there are four shortest paths from Entry to Exit, each with a total distance of 35 metres, but they don’t all have the same number of edges.
- Entry → L6 → U7 → U6 → L5 → L4 → L3 → L2 → Exit
- Entry → L6 → U7 → U6 → U5 → L4 → L3 → L2 → Exit
- Entry → L6 → U7 → U6 → U5 → U4 → M4 → L3 → L2 → Exit
- Entry → L6 → U7 → U6 → U5 → U4 → U3 → M3 → L2 → Exit
Draw out that this supermarket network has a regular structure because the edges are arranged vertically and horizontally on a background grid. This makes some distance comparisons easier, as students can count squares and see which sections of the path are forced. However, the shortest path still needs to be judged by the total distance travelled, not by the number of edges.
Conclude by explaining that this supermarket network is organised in a way that makes the shortest paths relatively easy to find by inspection. In a larger or less regular weighted network, where the structure is not as visually simple, a more systematic method may be needed.
Explain that finding the shortest path through the supermarket was made easier because the network was drawn on a grid, the edge lengths could be counted directly, and movement was only horizontal or vertical.
Introduce the next scenario:
A shopper has left the supermarket and now needs to walk through the carpark to reach their car. The network of pedestrian crossings in the carpark is less regular, so the shortest path may be harder to see by inspection.
Show Slide 20 with the first carpark network.
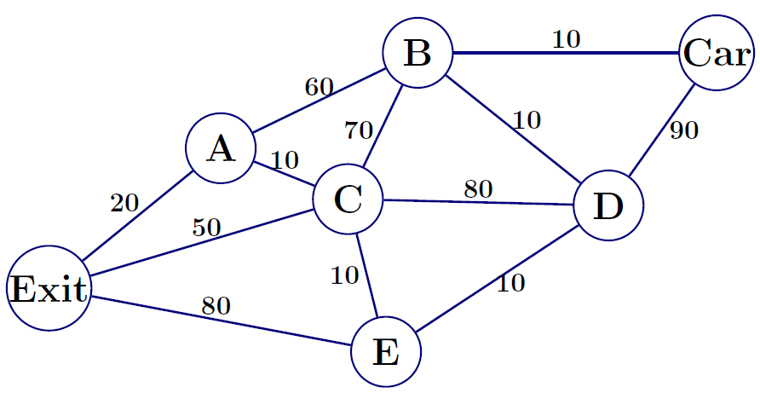
Discuss:
How is this network different from the supermarket network?
Draw attention to the fact that this network is a more abstract representation. The positions of the vertices and the lengths and directions of the edges are not intended to match the physical layout of the carpark or be drawn to scale. The labelled values, rather than the appearance of the diagram, show the distances between locations.
Ask: If you wanted a quick rule to find the shortest path that was easy to follow at each choice point, what could the rule be?
Draw out the idea that a sensible first attempt might be: at each choice, take the shortest available edge.
Introduce the language:
This is called a “greedy algorithm”. A greedy algorithm makes the choice that looks best at that moment, without checking whether it gives the best overall result.
Show Slide 21 with the greedy algorithm:
- Start at the Exit vertex.
- From the current vertex, choose the shortest connected edge to an unused vertex.
- Move to that next vertex.
- Repeat until the Car vertex is reached.
Ask students to apply the greedy algorithm to the first carpark network on page 2 of the Supermarket shortest path Student sheet.
Students record:
- the path produced by the greedy algorithm.
- the total distance of that path.
- whether they can find a shorter path by inspection.
Complete the animation on Slide 21 to confirm the application of the algorithm to the network.
Discuss:
- What path did the greedy algorithm produce?
- What was the total distance?
- Did the algorithm appear to work on this network?
- Why is this algorithm appealing to use?
Draw out that the greedy algorithm is attractive because it is simple, quick and easy to follow. For the first carpark network, the greedy algorithm seems to find the shortest path.
Show Slide 22 briefly as a verification only. Explain that technology has been used to check all possible paths, and in this network, the greedy algorithm does indeed find the shortest path.
Ask:
- Does this mean the greedy algorithm will always find the shortest path?
- What would count as evidence that it does not always work?
Draw out that one counterexample would be enough. This would require identifying a weighted network where the greedy algorithm chooses one path, but another path has a shorter total distance.
Show Slide 23 with the blank carpark network. This network is provided on page 2 of the Student sheet.
Set the challenge: Invite students to try to assign distances to the edges so that the greedy algorithm does not find the shortest path from Exit to Car.
Students should assign distances to the edges and then try to identify:
- the path chosen by the greedy algorithm.
- the total distance of the greedy path.
- a shorter path.
- the total distance of the shorter path.
As students work, circulate and ask questions such as:
- Which edge will the greedy algorithm choose first?
- Can that first choice lead to a longer total distance later?
- Could a path that starts with a longer edge become shorter overall?
- How are the greedy path and the shorter path being compared?
- What total distance does each path have?
Productive counterexamples

A productive counterexample is a carefully chosen example that shows students why an apparently sensible method does not always work. In this task, students first use a greedy algorithm on a carpark network where it successfully finds the shortest path, making the method seem efficient and trustworthy. They are then challenged to assign distances to a second network so that the greedy algorithm fails. This shifts students from simply using a method to testing its limits and constructing a counterexample for themselves.
This is mathematically important because it shows that sensible local choices do not always lead to the best overall solution. The counterexample creates a need for a more reliable strategy that keeps track of total distance, shortest known distances and vertices still to be checked.
More broadly, productive counterexamples help students refine their thinking and justify the need for stronger methods. Used well, they support discussion and reinforce that mathematical ideas should be tested, explained and improved.
A productive counterexample is a carefully chosen example that shows students why an apparently sensible method does not always work. In this task, students first use a greedy algorithm on a carpark network where it successfully finds the shortest path, making the method seem efficient and trustworthy. They are then challenged to assign distances to a second network so that the greedy algorithm fails. This shifts students from simply using a method to testing its limits and constructing a counterexample for themselves.
This is mathematically important because it shows that sensible local choices do not always lead to the best overall solution. The counterexample creates a need for a more reliable strategy that keeps track of total distance, shortest known distances and vertices still to be checked.
More broadly, productive counterexamples help students refine their thinking and justify the need for stronger methods. Used well, they support discussion and reinforce that mathematical ideas should be tested, explained and improved.
Bring the class together and ask one or two groups to share the edge distances they assigned and explain their thinking. Students may not have a complete counterexample, but probe for reasoning about how an early “short” choice could lead to a longer path overall.
Select a student example or use Slide 24 with a sample counterexample if needed.
Discuss:
- Which path did the greedy algorithm choose?
- What was the total distance of the greedy path?
- What shorter path was possible?
- Why did the greedy algorithm miss the shorter path?
Draw out that the greedy algorithm only considers the next shortest edge. It does not consider how that choice affects the total distance of the whole path.
Conclude:
The greedy algorithm is simple and quick, and it worked on the first carpark network. However, this counterexample shows that it is not always reliable. The challenge for the next lesson is to improve the method so it compares total distances, not just the next edge.