

Number: The secret patterns behind string art
View Sequence overviewAny point on a grid can be described using exactly two numbers.
The first number in a coordinate pair describes horizontal position and the second number describes vertical position.
Whole class
The secret patterns behind string art Slides
Access to Scratch
Each student
Quadrant 1 Student sheet
Rulers and pencils
Task
Display the image on Slide 3 of The secret patterns behind string art Slides.
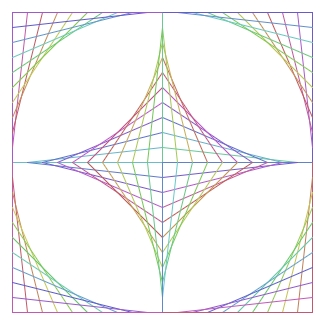
Ask: What do you notice? What are you wondering?
Take a few responses. Then ask: Can you see a pattern? How might you describe it?
- The design looks symmetrical.
- The image appears to contain curves, but is made entirely from straight lines.
- Each section of the image looks like a mirror of the others.
- The lines seem to follow a pattern.
If symmetry comes up, note it, as this idea will become useful later in the sequence.
Open Scratch on the board (or similar, so that students can follow along on the screen). Point to a blank Scratch window and say: By the end of this sequence, this program is going to draw this picture. Your job is to work out how.
Ask: Where would you even start?
Students may suggest starting with one line. Hold that idea and move on.
String art with string
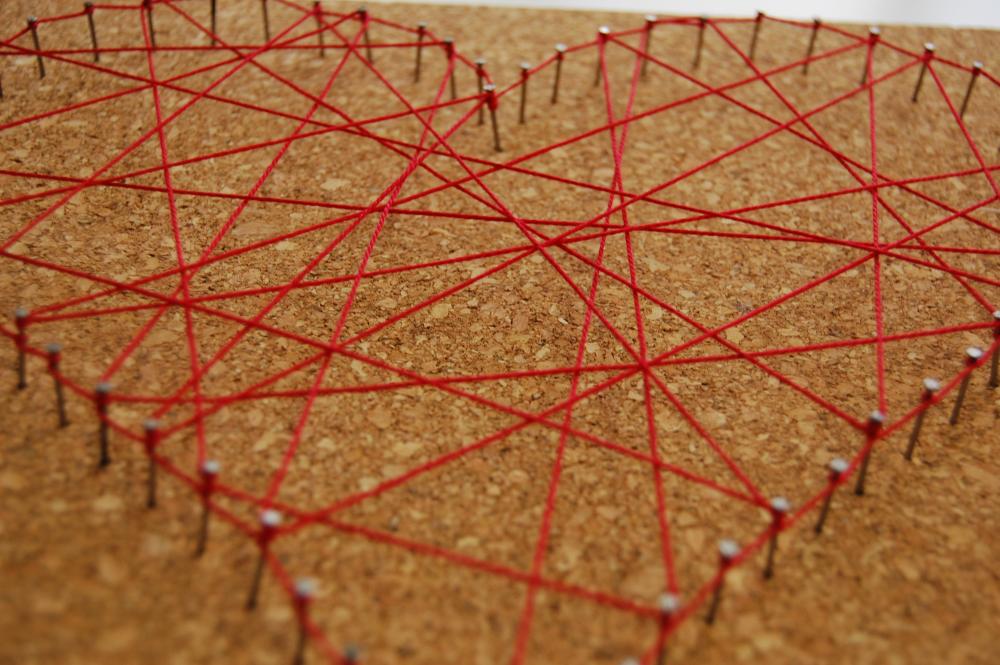
String art is a craft technique in which thread is wound between pins arranged on a board, with each piece of string forming a straight line between two points. The curve that appears is an illusion produced by many straight lines in sequence.
In this sequence, the reference lines are restricted to straight lines with evenly spaced points along the $x$- and $y$-axes. This constraint keeps the mathematics manageable so that students can focus on the pattern rather than the arithmetic. In the physical version, these constraints are more flexible. Pins can be arranged along a circle, a curve, or any shape at all, and the spacing does not need to be even or measured precisely.
For teachers looking to connect this sequence to the arts, a physical string art activity makes a natural companion project. It produces a tangible, displayable artefact that works well for cross-curricular exhibition work. Consider what adaptations might be needed to ensure all students can participate, such as pre-drilled boards, alternative fastening methods, or adjusted tools for students with fine motor difficulties.
String art is a craft technique in which thread is wound between pins arranged on a board, with each piece of string forming a straight line between two points. The curve that appears is an illusion produced by many straight lines in sequence.
In this sequence, the reference lines are restricted to straight lines with evenly spaced points along the $x$- and $y$-axes. This constraint keeps the mathematics manageable so that students can focus on the pattern rather than the arithmetic. In the physical version, these constraints are more flexible. Pins can be arranged along a circle, a curve, or any shape at all, and the spacing does not need to be even or measured precisely.
For teachers looking to connect this sequence to the arts, a physical string art activity makes a natural companion project. It produces a tangible, displayable artefact that works well for cross-curricular exhibition work. Consider what adaptations might be needed to ensure all students can participate, such as pre-drilled boards, alternative fastening methods, or adjusted tools for students with fine motor difficulties.
Say: If a computer is going to draw our picture, it needs an exact way to know where each line starts and ends.
Display Slide 4, showing a grid with objects at different locations. Ask: How would you describe where each object is to someone who couldn’t see this image?
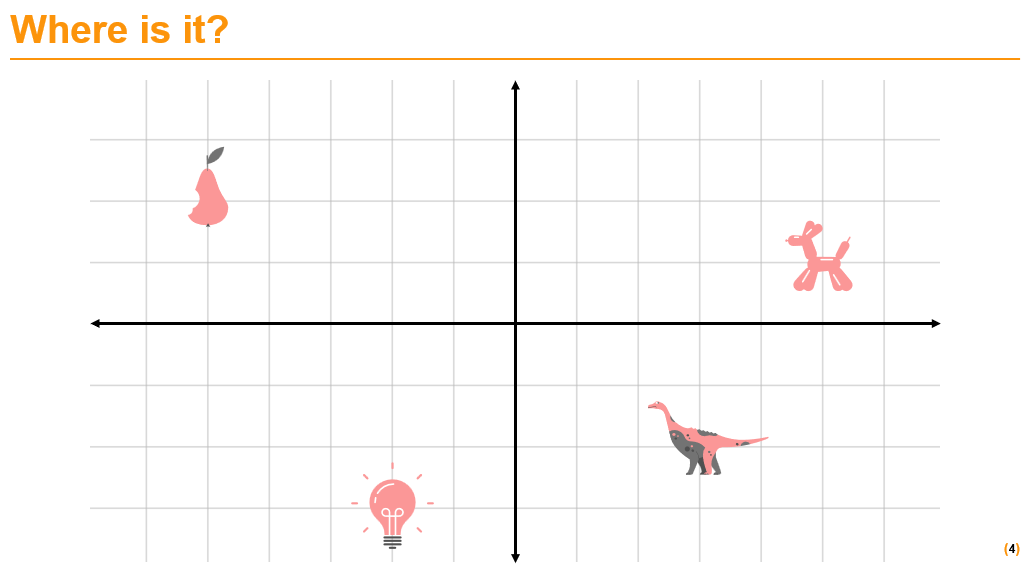
Students may offer different approaches: counting squares from the edge, describing distance from the centre, using compass directions. Record a few ideas side-by-side.
Ask: If I used your method and your partner used theirs, would we always end up at the same place? What could go wrong?
| If a student describes location by... | Try... |
|---|---|
| ...counting squares from the edge of the grid | What if someone else’s grid had a different number of squares? Would they find the same spot? |
| ...describing distance from the centre without specifying direction | You said four squares from the middle. But which way? How could you make that clearer? |
| ...using a nearby object as a reference (“next to the dinosaur”) | What if the dinosaur wasn’t there? Is there a way to describe a location that works no matter what else is on the grid? |
| ...providing a pair of numbers, but not specifying the order of the two numbers (“3 and 5”) | How do I know which number is across and which is up? Could we agree on a rule? |
Work toward two ideas together with the class:
- Identifying a shared reference point. Ask: Where could we all agree to start counting from? Establish that the point where the two axes cross is a useful shared reference point, and tell students this point is called the origin. Write numbers along the positive axes together with students, asking them where the numbers should go and what they should say.
- Identifying two directions from that point. Ask: What are the two directions we could move away from the origin? Draw out horizontal (left and right) and vertical (up and down).
For objects that sit to the left of or below the origin, such as the pear and the lightbulb, use informal language for now: the pear is to the left of the origin, the lightbulb is below it. If the class is ready, this is a natural moment to introduce negative numbers informally, asking students how they might write down a position to the left of or below the origin. Otherwise, explain that a more precise way of describing these positions will be introduced later in the sequence.
Ask: We have been describing locations using two numbers. How could we write those numbers down so someone else would understand it? Does the order matter?
Take a few responses. Then ask: If we write just “5, 1”, how does someone know which number means across and which means up? This surfaces the need for convention. Establish that the horizontal position is always written first, then the vertical, written as a pair in brackets.
Ask: If I say 5 across, does that tell you whether to go left or right? Draw out for now that “across” means “to the right” and “up” means “upward”. Introduce the labels $x$ for horizontal and $y$ for vertical.
Give students a coordinate pair in the first quadrant (where both numbers are positive) and ask them to point to where they think it will go before you mark it. Then reverse: mark a point and ask students for its coordinates.
| Point | What to ask |
|---|---|
| (3, 2) | How far right? How far up? |
| (2, 3) | How is this different from (3, 2)? |
| (5, 0) | Where is this? On which axis? |
| (0, 1) | How is this different from the last one? |
Close with: Two numbers, always in the same order. That is all we need to describe any point on this grid, for now…
Display Slide 5, which highlights just the top-right section of the string art image. Say: The full image has a lot going on. We are going to start by focusing on just this one section.
Display Slide 6 showing the same section with the first three lines drawn and the axes labelled.
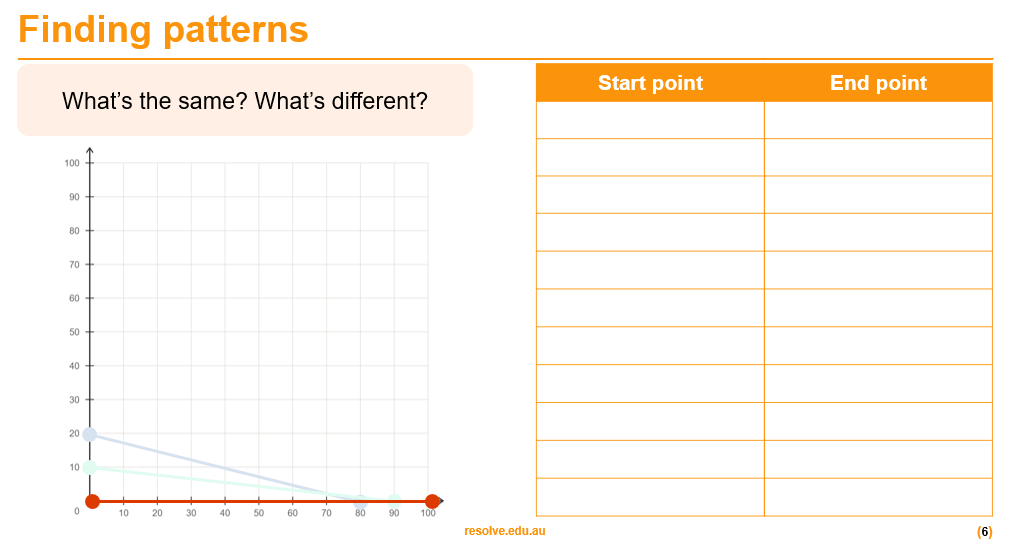
Starting with the red line, ask: If I follow this line to where it meets the horizontal axis, what coordinate am I at? That is the start point. And where does the line meet the vertical axis? That is the end point.
Some students may want to start with the vertical axis and record that as the start point instead. That choice is arbitrary, either works, but note that the rest of the sequence assumes lines are recorded starting from the horizontal axis.
Record the two coordinates in the table. Repeat for the green and blue lines. Slides 7-9 provide the coordinates of the three lines.
Ask: This point is right in the middle, where the two axes cross. How far along the horizontal axis is it? How far up the vertical axis?
Most students will arrive at zero for both. If needed, ask: Is the point to the right of zero, or to the left? Is it above zero or below?
Once the three coordinate pairs are established, provide students with the Quadrant 1 Student sheet. The first two lines are already drawn faintly on the grid and their coordinates are already recorded in the table. Ask students to draw over the first two lines using a ruler, placing it at the two coordinate pairs and drawing a straight line connecting them. For the third line, students use the information from the board, draw the line, and record the start/end coordinate pairs in the table.
Before students work out the coordinates of the next line or put ruler to paper, ask them to predict: What do you think the next line will be? Where will it start? Where will it end? Students commit to a prediction first, then work out the coordinates and draw the line to check.
Students continue this predict, draw, check routine for the remaining lines.
Why predict before drawing?
Asking students to predict the next line before drawing it is an application of the Predict-Observe-Explain (POE) strategy (White and Gunstone, 1992): students commit to a justified prediction, observe the result, then reconcile any gap between the two.
In this activity, that means asking students to commit to a start and end coordinate for the next line before they pick up the ruler, based on what they have recorded in the table so far. Committing to a prediction gives students a reason to check their table carefully rather than just copying the next pair of numbers down. If a student has recorded (80, 0) to (0, 20) for line 3 and predicts line 4 will be (70, 0) to (0, 20), forgetting that the second number also changes, the mismatch when they draw it is more useful than getting it right first time: it forces them back to the table to work out exactly which column they lost track of, and that act of correction tends to embed the pattern more firmly than drawing a correct line without ever having been wrong (Muller, 2008). If the prediction is right, it confirms they are reading the pattern in the coordinates, not just following the ruler mechanically. The same routine repeats through the sequence as predict/code/check, so establishing it here, on paper, gives students a habit they can carry into Scratch.
References
White, R., & Gunstone, R. (1992). Probing understanding. The Falmer Press.
Muller, D. A. (2008). Designing effective multimedia for physics education. University of Sydney.
Asking students to predict the next line before drawing it is an application of the Predict-Observe-Explain (POE) strategy (White and Gunstone, 1992): students commit to a justified prediction, observe the result, then reconcile any gap between the two.
In this activity, that means asking students to commit to a start and end coordinate for the next line before they pick up the ruler, based on what they have recorded in the table so far. Committing to a prediction gives students a reason to check their table carefully rather than just copying the next pair of numbers down. If a student has recorded (80, 0) to (0, 20) for line 3 and predicts line 4 will be (70, 0) to (0, 20), forgetting that the second number also changes, the mismatch when they draw it is more useful than getting it right first time: it forces them back to the table to work out exactly which column they lost track of, and that act of correction tends to embed the pattern more firmly than drawing a correct line without ever having been wrong (Muller, 2008). If the prediction is right, it confirms they are reading the pattern in the coordinates, not just following the ruler mechanically. The same routine repeats through the sequence as predict/code/check, so establishing it here, on paper, gives students a habit they can carry into Scratch.
References
White, R., & Gunstone, R. (1992). Probing understanding. The Falmer Press.
Muller, D. A. (2008). Designing effective multimedia for physics education. University of Sydney.
Why does it look like a curve?
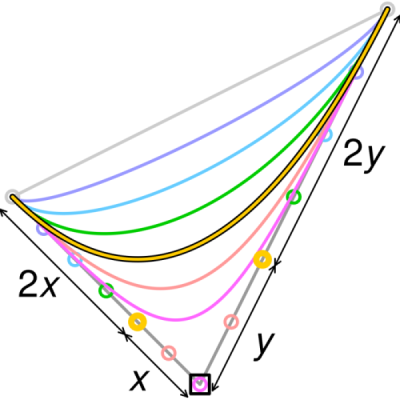
When students finish drawing the 11 lines of quadrant 1, most will notice that the lines seem to form a curve, even though every single line is straight. This curvet has a name: a quadratic Bézier curve.
A Bézier curve is defined by a set of control points. The simplest version, a quadratic Bézier, uses three points: a start point, an end point, and one control point in between. The curve is pulled toward the control point without actually passing through it, which is what gives it its characteristic smooth bend. In the string art design, the three control points are (100, 0), (0, 100), and (0, 0). The curve starts at (100, 0), ends at (0, 100), and is pulled toward the origin (0, 0) without ever reaching it. This is why the curve appears to hug the corner of the two axes: the origin is acting as a kind of invisible magnet, bending the curve toward it.
Bézier curves appear throughout the digital world, but perhaps the most universal example is font design. Every letter in every digital font is defined by Bézier curves. When a computer renders the letter “S”, it does not store thousands of pixels: it stores a handful of control points, typically four to eight, and uses a mathematical formula to calculate the smooth curve between them at whatever size is needed. This is why fonts scale perfectly. A font displayed at 12 points and the same font displayed at 200 points are produced from exactly the same control points: the formula simply recalculates the curve at the new size. There are no pixels being stretched or blurred, just the same mathematical relationship applied at a different scale.
When students finish drawing the 11 lines of quadrant 1, most will notice that the lines seem to form a curve, even though every single line is straight. This curvet has a name: a quadratic Bézier curve.
A Bézier curve is defined by a set of control points. The simplest version, a quadratic Bézier, uses three points: a start point, an end point, and one control point in between. The curve is pulled toward the control point without actually passing through it, which is what gives it its characteristic smooth bend. In the string art design, the three control points are (100, 0), (0, 100), and (0, 0). The curve starts at (100, 0), ends at (0, 100), and is pulled toward the origin (0, 0) without ever reaching it. This is why the curve appears to hug the corner of the two axes: the origin is acting as a kind of invisible magnet, bending the curve toward it.
Bézier curves appear throughout the digital world, but perhaps the most universal example is font design. Every letter in every digital font is defined by Bézier curves. When a computer renders the letter “S”, it does not store thousands of pixels: it stores a handful of control points, typically four to eight, and uses a mathematical formula to calculate the smooth curve between them at whatever size is needed. This is why fonts scale perfectly. A font displayed at 12 points and the same font displayed at 200 points are produced from exactly the same control points: the formula simply recalculates the curve at the new size. There are no pixels being stretched or blurred, just the same mathematical relationship applied at a different scale.
Build the completed table on the board from students’ own results. A completed table is also provided on Slide 10 if needed. Ask: What patterns can you see in this table?
As students share observations, record them alongside the table. If students have only noticed patterns going down the columns, prompt them to look across the rows too, and vice versa.
| Pattern students might notice | Prompt to elicit it |
|---|---|
| The $x$-coordinate of the start point decreases by 10 each time. | Looking down the first column, what do you notice about the $x$-coordinates of the start points? |
| The $y$-coordinate of the end point increases by 10 each time. | What about the $y$-coordinates of the end points? What is happening as you go down the table? |
| The two non-zero numbers in each row add to 100. | Look at just one row. What do you notice about the two non-zero numbers? Does that hold for every row? |
| The $y$-coordinate of every start point is 0. | What do all the start points have in common? |
| The $x$-coordinate of every end point is 0. | What do all the end points have in common? |
Ask: How many lines did we draw altogether?
Establish that 11 lines were drawn. Say: 11 lines. Hold that number in mind. It’s going to come up again.
Reflect on the lesson
Close the lesson by returning to where it started. Say: At the start of the lesson, we asked how we could get a computer to draw this picture. We now know exactly where every one of these lines starts and ends. This is exactly the information a computer would need. We just need to work out how to tell it.