

Number: The secret patterns behind string art
View Sequence overviewNegative numbers describe direction from a reference point.
A negative $x$-coordinate describes a point to the left of the origin; a negative $y$-coordinate describes a point below it.
An algorithm built for one purpose can often be reused, with small modifications, for a similar purpose.
Whole class
The secret patterns behind string art Slides
Each student
Quadrant 2 Student sheet
Devices with access to Scratch
Task
Display Slide 25 of The secret patterns behind string art Slides, showing the full string art image with the first section highlighted in blue. Ask: We have drawn the highlighted section. What would we need to draw the rest?
Students will likely notice that the other sections look like mirror images, and that some lines go to the left of and below the section they have already drawn. Ask: Using what we know about coordinates, could we describe where those lines start and end?
Some students may already suggest using negative numbers or a minus sign. Others may use language from Task 1 such as “left of the middle” or “below the middle.”
Say: In Task 1 we said we would come back to how to describe those points properly. Today we are going to use this to figure out how to draw the rest of the picture.
Point to the pear on Slide 26. Ask: In Task 1 we said the pear was to the left of the origin. How far do you think it is? How could we capture both the distance and the direction using numbers?
Students may suggest using a minus sign, writing “negative”, using an arrow, or other informal notations. Then ask: We write $\mathit{(3, 2)}$ to mean 3 to the right and 2 up. If we wanted to go the other way, how do you think we might change that?
Give students a moment to think and discuss with a partner before taking responses. Work toward the idea that a minus sign indicates the opposite direction: left instead of right, down instead of up.
If students are not arriving at the minus sign notation, display Slide 27 which shows the objects labelled with their coordinates. Ask: What do you notice about these coordinates? What is the same as the ones we have used before? What is different?
Once the notation is established, plot two or three points together as a class, asking students to tell you where each one goes before marking it.
Ask: Looking at the coordinates for the pear, light bulb, and dinosaur, what does a minus sign in front of the $x$-coordinate tell us? What about a minus sign in front of the $y$-coordinate?
If students are giving partial answers, ask:
- For the coordinates $\mathit{(-50, 0)}$ and $\mathit{(50, 0)}$,, what is the same about these two points? What is different?
- If I told you a point had a negative $y$-coordinate, could you tell me roughly where it would be on the grid?
- Is a negative number smaller than zero, or just in a different direction? What do the points we plotted suggest?
Work toward a shared statement that a negative $x$-coordinate describes a point to the left of the origin and a negative $y$-coordinate describes a point below the origin. The distance from the origin is the same: only the direction changes.
Then ask: Look back at the string art image. The quadrant 2 section and the quadrant 1 section look like mirror images. Does that connect to anything we just said about negative numbers?
If students noticed the reflection earlier, invite them to explain the connection in their own words. The idea to draw out is that when you reflect a shape, the coordinates change sign but the distances stay the same.
Negative numbers as direction versus magnitude
Students most commonly encounter negative numbers as numbers that are less than zero: -3 is less than -2, which is less than 0. This works well in contexts like temperature or debt, but in coordinates, negative numbers do something different. A negative $x$-coordinate does not mean a point is less than the origin: it means the point is in the opposite direction. Both $(-50, 0)$ and $(50, 0)$ are exactly 50 units from the origin. The sign describes direction, not magnitude.
Students who only have the order interpretation may find negative coordinates confusing. The number line is a useful bridge: -3 sits to the left of 0, which sits to the left of 3. The $x$-axis is simply a number line, and extending it to the left of the origin is the same idea. The two interpretations are not contradictory: they are the same idea applied in different contexts.
In senior mathematics this distinction becomes formal, with magnitude written as an absolute value and sign indicating direction. At Year 6, that language is not needed, but the underlying idea—that a minus sign tells you which way, not how much—is worth establishing early.
Students most commonly encounter negative numbers as numbers that are less than zero: -3 is less than -2, which is less than 0. This works well in contexts like temperature or debt, but in coordinates, negative numbers do something different. A negative $x$-coordinate does not mean a point is less than the origin: it means the point is in the opposite direction. Both $(-50, 0)$ and $(50, 0)$ are exactly 50 units from the origin. The sign describes direction, not magnitude.
Students who only have the order interpretation may find negative coordinates confusing. The number line is a useful bridge: -3 sits to the left of 0, which sits to the left of 3. The $x$-axis is simply a number line, and extending it to the left of the origin is the same idea. The two interpretations are not contradictory: they are the same idea applied in different contexts.
In senior mathematics this distinction becomes formal, with magnitude written as an absolute value and sign indicating direction. At Year 6, that language is not needed, but the underlying idea—that a minus sign tells you which way, not how much—is worth establishing early.
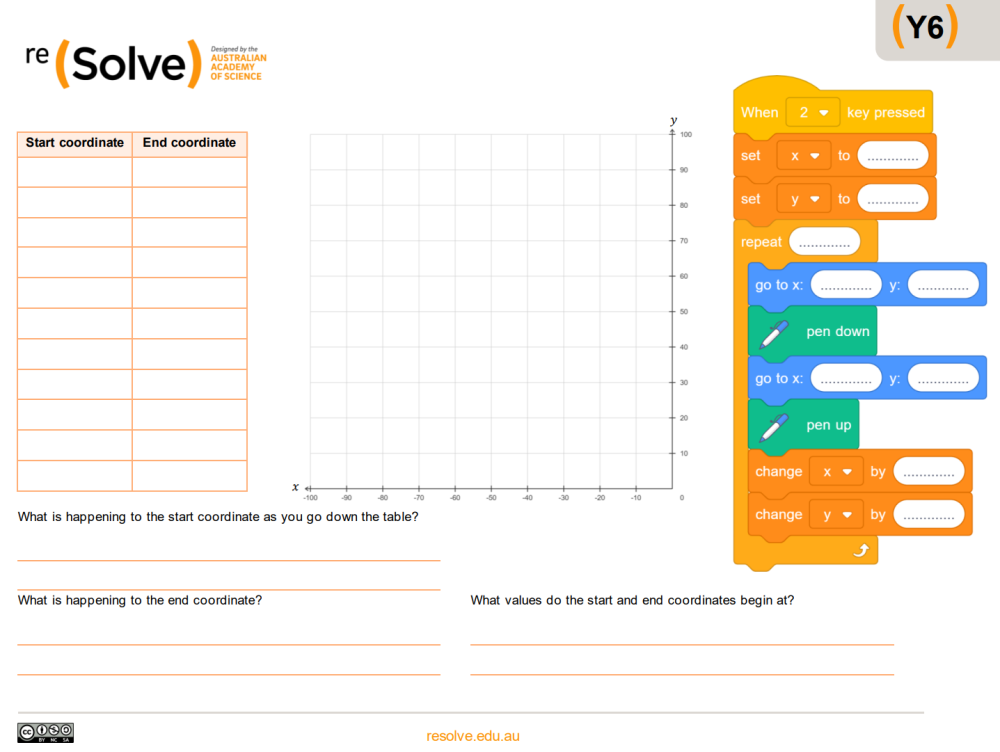
Provide students with the Quadrant 2 Student sheet. Say: This sheet has three parts. First, draw the string art lines for this section of the image and record the coordinates in the table as you go. Then answer the questions at the bottom to help you think about what the code would look like. Finally, use what you have found to fill in the blanks in the code.
Remind students of the routine from Task 1: Every time you finish a line, stop. Predict what comes next, then check.
Predicting on paper before testing in Scratch
Letting students tinker on a computer has its own benefits. When a student changes a value and immediately sees the result, the feedback is instant and concrete. That kind of hands-on experimentation can build intuition quickly, and students often discover things through play that they would not have found through more structured work. The computer makes mathematics tangible in a way that paper cannot.
But free exploration also has limits. Without a prediction to test, students may not know what to look for when the output appears. A student who changes a value, sees something unexpected, shrugs, and changes something else, is learning that coding involves a lot of guessing.
Paper forces a different kind of thinking. When students write pseudo code without access to a computer, they cannot try something and see what happens. They have to reason about what each line of code should contain before committing to an answer. That reasoning is where the mathematical work happens: connecting the pattern in the table to the structure of the code, and deciding what value belongs where and why.
Using both, in sequence, gets the best of each. Using paper first builds the prediction. Scratch then tests it. If the output matches, students have confirmed their reasoning. If it does not, they have a specific hypothesis to investigate rather than an unexplained result to stare at. The computer’s instant feedback becomes most useful when students already have something concrete to compare it against.
Letting students tinker on a computer has its own benefits. When a student changes a value and immediately sees the result, the feedback is instant and concrete. That kind of hands-on experimentation can build intuition quickly, and students often discover things through play that they would not have found through more structured work. The computer makes mathematics tangible in a way that paper cannot.
But free exploration also has limits. Without a prediction to test, students may not know what to look for when the output appears. A student who changes a value, sees something unexpected, shrugs, and changes something else, is learning that coding involves a lot of guessing.
Paper forces a different kind of thinking. When students write pseudo code without access to a computer, they cannot try something and see what happens. They have to reason about what each line of code should contain before committing to an answer. That reasoning is where the mathematical work happens: connecting the pattern in the table to the structure of the code, and deciding what value belongs where and why.
Using both, in sequence, gets the best of each. Using paper first builds the prediction. Scratch then tests it. If the output matches, students have confirmed their reasoning. If it does not, they have a specific hypothesis to investigate rather than an unexplained result to stare at. The computer’s instant feedback becomes most useful when students already have something concrete to compare it against.
Before testing their code, tell students: Here are three attempts at writing the loop for quadrant 2. Before we see what each one produces, let’s predict.
Display Slide 28. Ask: Here is someone’s attempt at writing the loop for quadrant 2. Before we see what it produces, what do you predict will happen?
Take predictions and ask students to justify their reasoning. Then reveal the animation. Ask: Was that what you expected? What went wrong? What would need to change to fix it?
Repeat for Slide 29 and 30.
| Example | The error | If students cannot predict what will happen, try... |
|---|---|---|
| 1 | set x to 100 instead of set x to -100 | Compare this code to your quadrant 1 loop. Can you find anything that is different? If nothing has changed, what do you think will happen? |
| 2 | change x by -10 instead of change x by 10 | Look at the change x by ( ) block. In quadrant 1, x started at 100 and decreased. What is happening to x here? Where will it end up after a few repetitions? |
| 3 | set x to 0 instead of set x to -100, and change x by -10 instead of change x by 10 | Look at the set x to ( ) block. If x starts at 0 and decreases by 10 each time, where will the first line start? Point to that on the grid. |
Tell students: You have predicted what the loop should look like on your worksheet. Now test it. Open Scratch, duplicate your quadrant 1 loop, and make the changes you wrote on your worksheet.
Students run the code and check it against the prediction on their worksheet.
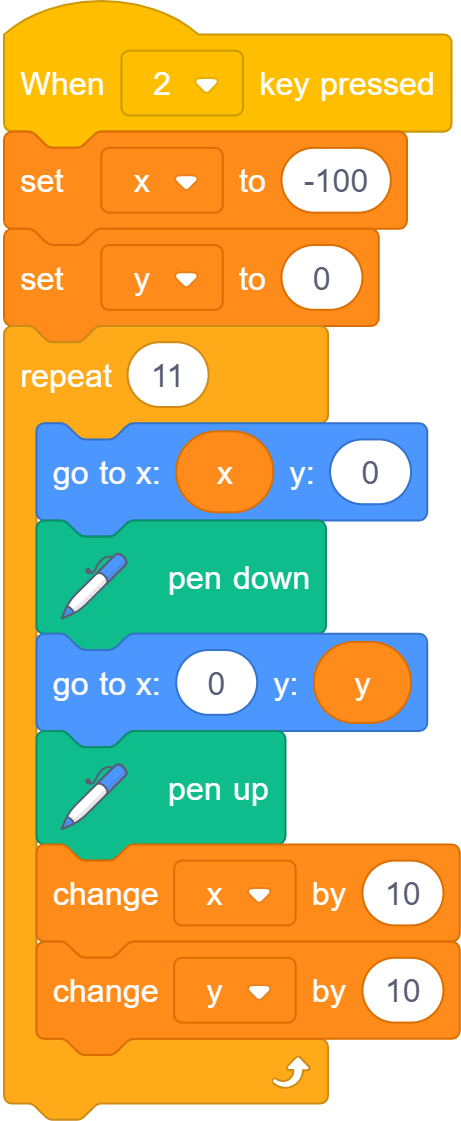
Below is one solution for quadrant 2.
| If a student... | Try... |
|---|---|
| ...gets an output that does not match their prediction | Does your Scratch code match exactly what you wrote on your worksheet? Check each blank space on your worksheet one at a time. |
| ...has copied from the worksheet correctly but their image looks wrong | Which line looks wrong? Point to it. Now trace through the loop for that repetition. What are the values of x and y at that point? |
| ...has lines appearing in the wrong quadrant | Check your starting value for x. What did you write on your worksheet? What does your Scratch code say? |
| ...has lines in the correct position, but has too many or too few | How many times does your loop repeat? How many lines should it draw? |
Students who are finding coding the loop too challenging can instead draw each line in quadrant 2 one at a time in Scratch, using the coordinates from their worksheet table as a reference. This mirrors what the class did in Task 2 for quadrant 1. The predict/code/check routine applies in the same way: for each line, predict where it will appear, code it, then check. Once all lines are drawn, these students can return to the worksheet and attempt the loop section with their completed table as a reference.
Show Slide 31, which shows the code for quadrant 1 on the left and quadrant 2 on the right. Ask: Look at the two sets of code. What’s the same? How do they differ?
If students struggle spotting the difference, work through the two loops systematically, one block at a time from top to bottom. For each block, ask: Is this block the same in both loops, or different? Students work down through the code until they find the block that differs.
Work toward the observation that there are two differences between the loops: the starting value of x is -100 instead of 100, and the change x by ( ) block contains 10 instead of -10. Everything else is identical.
Using the following prompts to facilitate a class discussion:
- In quadrant 1, x started at 100 and we changed it by -10 each time. Why did it need to decrease?
- Draw out that x needed to move from 100 toward 0, so subtracting 10 each time made sense.
- In quadrant 2, x starts at -100. Where does it need to get to? So does it need to increase or decrease?
- Draw out that x needs to move from -100 toward 0, which means adding 10 each time. The direction of change flips because the starting position is on the other side of zero.
- The two quadrants look like mirror images. Does that connect to anything we said about negative numbers earlier?
- Draw out that the negative sign reverses the direction of the $x$-coordinates, which places every line in the mirror position across the $y$-axis. The change x by ( ) value flips for the same reason: moving toward zero from the left requires adding, not subtracting.
- We have two sections of the full picture. We need two more. What do you think would need to change in the loop to draw quadrant 3? What about quadrant 4?
- Record suggestions on the board, then ask students to vote for the one they think is most likely to be correct. Record the votes alongside the predictions.
Tell students that the class will come back to these predictions at the start of the next task to find out who was right.